

Overview
Compare with Nova Ltd., Optex Systems Holdings Inc or SYNTEC OPTICS HOLDINGS, INC., or pick any stock.
- TickerCAMT on Nasdaq1
- Industryelectronics1
- HeadquartersMigdal HaEmek1
- Founded inIsrael1
- Websitewww.camtek.com
- Legal formlimited company1
- Incorporated inIsrael6
- Business addressIndustrial Zone, Po Box 544, Migdal Haemek6
- Filer categoryLarge accelerated filer6
- LEI5493000H80W07HCKGS433
- StatusActive3
- LEI statusIssued and current3
- Registered addressRAMAT GABRIEL INDUSTRIAL ZONE, 2310502 Migdal Haemek, Israel3
- Registered withIsraeli Corporations Authority (Department of Justice), 5112354343
See how the biggest companies compare on our leaderboards
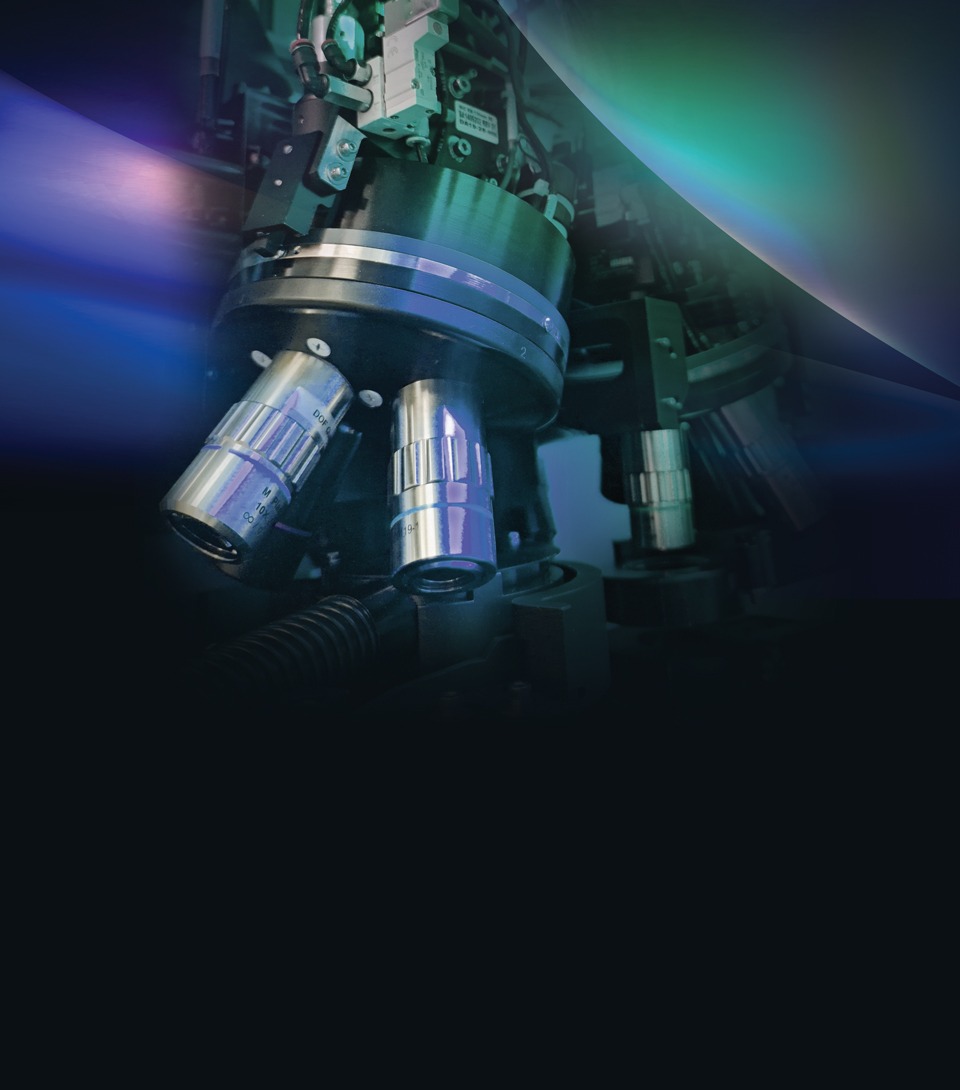
United States (CFIUS) and the Taiwan Overseas Foreign Investment Commission (MOEAIC).7 From its latest annual report
Financials
From the company’s reports to the SEC. Every number links to the filing it came from.
Key numbers, fiscal 2025
What sells
Revenue by product, business segment and region, as the company reports it to the SEC.
Products and services
Sales of products brought in 94% of the revenue Camtek Ltd. broke down this way in fiscal 2025.
Products and services by year
| Products and services | 2023 | 2024 | 2025 |
|---|---|---|---|
| Sales of products | $301.9M | $409.4M | $468.5M |
| Service Fees | $13.5M | $19.8M | $27.6M |
Regions
[Canada] brought in 49% of the revenue Camtek Ltd. broke down this way in fiscal 2025.
Regions by year
| Regions | 2023 | 2024 | 2025 |
|---|---|---|---|
| [Canada] | $149.5M | $132.6M | $243.9M |
| Asia Pacific | $67.8M | $133.8M | $169.0M |
| South Korea | $47.4M | $117.1M | $36.9M |
| United States | $41.1M | $29.3M | $28.8M |
| Europe | $9.5M | $16.5M | $17.4M |
Where the money goes
Where each dollar of revenue went, fiscal 2025
- Cost of revenue50¢$245.8M
- Research and development10¢$48.3M
- Selling, general and admin15¢$73.8M
- Other costs15¢$75.9M
- Income tax0¢$1.6M
- Profit10¢$50.7M
Out of $496.1M in revenue.5
Where each dollar of operating cash went, fiscal 2025
- Capital spending10¢$14.4M
- Kept or used elsewhere90¢$127.5M
Out of $141.9M of cash from operations.5
Financial statements
No quarterly figures reported.
Every line of the income statement as filed: the last 3 fiscal years, latest first.5
| Period ending | 2025-12-31 | 2024-12-31 | 2023-12-31 |
|---|---|---|---|
| Revenues | $496.1M | $429.2M | $315.4M |
| Cost of revenues | $245.8M | $219.3M | $167.7M |
| Gross profit | $250.3M | $210.0M | $147.6M |
| Research and development | $48.3M | $38.3M | $31.5M |
| Selling, general and administrative | $73.8M | $63.6M | $50.8M |
| Total operating expenses | $122.1M | $101.9M | $82.2M |
| Operating profit | $128.2M | $108.1M | $65.4M |
| Financial income, net | $25.1M | $23.2M | $22.2M |
| Other expenses | -$100.9M | $0 | $0 |
| Income (loss) before income taxes | $52.3M | $131.2M | $87.6M |
| Income tax expense | -$1.6M | -$12.7M | -$9.0M |
| Net income | $50.7M | $118.5M | $78.6M |
| Basic net earnings per share | $1.11 | $2.62 | $1.76 |
| Diluted net earnings per share | $1.04 | $2.42 | $1.63 |
| Basic | 45.7K shares | 45.3K shares | 44.7K shares |
| Diluted | 50.0K shares | 49.4K shares | 48.9K shares |
No quarter-by-quarter statement was filed.
No quarterly figures reported.
Every line of the balance sheet as filed: the last 4 fiscal years (annual) or 4 quarters (quarterly), latest first.5
| Period ending | 2025-12-31 | 2024-12-31 | 2023-12-31 | 2022-12-31 |
|---|---|---|---|---|
| Cash and cash equivalents | $177.8M | $126.2M | ||
| Short-term deposits | $411.4M | $231.0M | ||
| Marketable securities | $78.9M | $30.8M | ||
| Trade accounts receivable, net | $90.8M | $99.5M | ||
| Inventories | $112.2M | $111.2M | ||
| Other current assets | $25.8M | $21.3M | ||
| Total current assets | $897.0M | $620.1M | ||
| Long-term deposits | $0 | $26.0M | ||
| Marketable securities | $182.9M | $87.1M | ||
| Long-term inventory | $15.6M | $11.9M | ||
| Deferred tax asset, net | $12.9M | $3.1M | ||
| Other assets, net | $1.9M | $2.0M | ||
| Property, plant and equipment, net | $65.1M | $54.2M | ||
| Intangible assets, net | $10.1M | $13.4M | ||
| Goodwill | $74.3M | $74.3M | ||
| Total non-current assets | $362.8M | $272.0M | ||
| Total assets | $1.3B | $892.0M | ||
| Trade accounts payable | $33.7M | $46.6M | ||
| Other current liabilities | $73.7M | $77.3M | ||
| Total current liabilities | $107.4M | $123.9M | ||
| Deferred tax liabilities, net | $1.3M | $5.6M | ||
| Other long-term liabilities | $14.3M | $15.4M | ||
| Convertible notes | $519.8M | $197.9M | ||
| Total noncurrent liabilities | $535.4M | $218.9M | ||
| Total liabilities | $642.8M | $342.8M | ||
| Ordinary shares NIS 0.01 par value, 100,000,000 shares authorized at December 31, 2025 and 2024; 47,920,509 and 47,541,682 issued shares at December 31, 2025 and 2024, respectively; 45,828,133 and 45,449,306 shares outstanding at December 31, 2025 and 2024, respectively | $178.0K | $177.0K | ||
| Additional paid-in capital | $231.9M | $214.9M | ||
| Accumulated other comprehensive income | $287.0K | $203.0K | ||
| Retained earnings | $386.5M | $335.8M | ||
| Total shareholders' equity before treasury stock | $618.9M | $551.1M | ||
| Treasury stock, at cost (2,092,376 shares as of December 31, 2025 and 2024) | -$1.9M | -$1.9M | ||
| Total shareholders' equity | $617.0M | $549.2M | $476.1M | $384.1M |
| Total liabilities and shareholders' equity | $1.3B | $892.0M | ||
| Ordinary shares, par value per share | 0.01 ILS | 0.01 ILS | ||
| Ordinary shares, shares authorized | 100.0M shares | 100.0M shares | ||
| Ordinary shares, shares issued | 47.9M shares | 47.5M shares | ||
| Ordinary shares, shares outstanding | 45.8M shares | 45.4M shares | ||
| Treasury stock, shares | 2.1M shares | 2.1M shares |
Cash flow is reported year to date, not quarter by quarter, so there are no separate quarterly figures.
Every line of the cash flow as filed: the last 3 fiscal years, latest first.5
| Period ending | 2025-12-31 | 2024-12-31 | 2023-12-31 |
|---|---|---|---|
| Net Income (Loss) | $50.7M | $118.5M | $78.6M |
| Depreciation and amortization | $11.8M | $10.7M | $5.8M |
| Deferred tax benefit | -$15.3M | -$1.8M | -$1.3M |
| Amortization of debt issuance costs | $1.7M | $1.1M | $1.1M |
| Share based compensation expense | $16.9M | $14.5M | $12.6M |
| Change in provision for doubtful debts | -$47.0K | $34.0K | $100.0K |
| Other non-cash expenses | $28.0K | $260.0K | $6.0K |
| Other expenses | $100.9M | $0 | $0 |
| Financial income related to finance lease liabilities | $902.0K | -$102.0K | $0 |
| Amortization of marketable securities | -$1.6M | $0 | $0 |
| Trade accounts receivable, gross | $7.6M | -$12.2M | -$1.9M |
| Inventories | -$8.3M | -$32.2M | -$13.7M |
| Due from related parties | -$5.0K | $3.0K | -$3.0K |
| Other assets | -$4.3M | -$3.7M | -$6.8M |
| Trade accounts payable | -$13.2M | $4.3M | $10.1M |
| Other current liabilities | -$6.4M | $22.9M | -$5.4M |
| Change in operating lease asset | -$769.0K | -$1.1M | -$480.0K |
| Change in operating lease liability | $1.2M | $967.0K | $480.0K |
| Net cash provided by operating activities | $141.9M | $122.2M | $79.3M |
| Acquisition of subsidiary consolidated for the first time | $0 | $0 | -$101.8M |
| Proceeds from acquisition | $0 | $1.3M | $0 |
| Proceeds from (investment in) short-term deposits, net | -$180.4M | -$15.8M | $36.2M |
| Proceeds from (investment in) long-term deposits | $26.0M | -$5.0M | $58.0M |
| Purchase of fixed assets | -$14.4M | -$10.1M | -$8.1M |
| Purchase of intangible assets | -$403.0K | -$261.0K | -$173.0K |
| Purchase of marketable securities | -$215.2M | -$45.8M | -$103.5M |
| Redemption of marketable securities | $74.1M | $19.7M | $11.9M |
| Net cash used in investing activities | -$310.3M | -$55.9M | -$107.5M |
| Proceeds from exercise of share options | $0 | $42.0K | $182.0K |
| Finance lease liability | -$331.0K | -$42.0K | $0 |
| Dividend payment | $0 | -$60.0M | $0 |
| Convertible Notes issued | $500.0M | $0 | $0 |
| Issuance costs for Convertible Notes | -$13.7M | $0 | $0 |
| Redemption of Convertible Notes | -$267.0M | $0 | $0 |
| Net cash (used in) provided by financing activities | $219.0M | -$60.0M | $182.0K |
| Effect of exchange rate changes on cash | $1.1M | -$26.0K | -$241.0K |
| Net increase (decrease) in cash and cash equivalents | $51.6M | $6.3M | -$28.2M |
| Acquisition of subsidiary, consolidated for the first time: | $0 | $1.3M | -$101.8M |
| Income taxes paid | $14.5M | $10.4M | $13.8M |
| Interest received | $27.4M | $22.7M | $18.7M |
| Operational lease payments | $2.6M | $2.2M | $1.9M |
| Fixed assets purchased with supplier credit | $677.0K | $435.0K | $267.0K |
| Right-of-use asset recognized with corresponding operating lease liability | $3.0M | $2.1M | $2.6M |
| Right-of-use asset recognized with corresponding financial lease liability | $0 | $4.9M | $0 |
| Exercise of shares prior to receipt of payment | $70.0K | $0 | $0 |
No quarter-by-quarter statement was filed.
Corporate structure
Camtek Ltd. sits at the top of its group. 1 entity, 1 country on record. Switch between the flow chart and the network, and select any entity to see its details.
Major holders of Camtek Ltd.
- Phoenix Financial Ltd. Filed SCHEDULE 13G on Camtek Ltd., latest Aug 11, 2026 (3 filings since May 30, 2023)
- Migdal Insurance & Financial Holdings Ltd. Filed SCHEDULE 13G/A on Camtek Ltd., latest Jul 23, 2026 (5 filings since Feb 2, 2022)
- WASATCH ADVISORS LP Filed SCHEDULE 13G/A on Camtek Ltd., latest Jul 9, 2026 (6 filings since May 13, 2025)
- Harel Insurance Investments & Financial Services Ltd. Filed SCHEDULE 13G/A on Camtek Ltd., latest May 5, 2026 (2 filings since Dec 23, 2025)
- Camtek Ltd. Migdal Haemek, Israel
Built from parent and subsidiary links from GLEIF, the Global Legal Entity Identifier Foundation (CC0); major holders from Schedules 13D and 13G. Each entity in the chart links to its source.
What it owns
What Camtek Ltd. reports owning in its annual reports to the SEC: buildings, land and equipment, real estate and locations, investments, intangible assets and inventory, at the end of its latest fiscal year and a year before.
Property and equipment
| Item | Latest | A year before | Change |
|---|---|---|---|
| Computer equipment and software | $12.2M5 Dec 31, 2025 | $12.2M5 Dec 31, 2024 | 0% |
| Property and equipment, before depreciation | $100.8M5 Dec 31, 2025 | $79.9M5 Dec 31, 2024 | +26.1% |
| Accumulated depreciation | $35.7M5 Dec 31, 2025 | $25.7M5 Dec 31, 2024 | +38.6% |
| Property and equipment, net | $65.1M5 Dec 31, 2025 | $54.2M5 Dec 31, 2024 | +20.1% |
| Finance-lease assets | $4.8M5 Dec 31, 2025 | $4.9M5 Dec 31, 2024 | −1.7% |
Investments
| Item | Latest | A year before | Change |
|---|---|---|---|
| Cash and cash equivalents | $177.8M5 Dec 31, 2025 | $126.2M5 Dec 31, 2024 | +40.9% |
| Marketable securities, current | $78.9M5 Dec 31, 2025 | $30.8M5 Dec 31, 2024 | +155.9% |
| Marketable securities, non-current | $182.9M5 Dec 31, 2025 | $87.1M5 Dec 31, 2024 | +110.0% |
| Debt securities available for sale | $261.8M5 Dec 31, 2025 | $117.9M5 Dec 31, 2024 | +122.0% |
Intangibles and goodwill
| Item | Latest | A year before | Change |
|---|---|---|---|
| Goodwill | $74.3M5 Dec 31, 2025 | $74.3M5 Dec 31, 2024 | 0% |
| Intangible assets, net (excluding goodwill) | $10.1M5 Dec 31, 2025 | $13.4M5 Dec 31, 2024 | −24.7% |
| Finite-lived intangibles, gross | $19.9M5 Dec 31, 2025 | $19.5M5 Dec 31, 2024 | +2.1% |
| Accumulated amortization | $9.8M5 Dec 31, 2025 | $6.1M5 Dec 31, 2024 | +60.5% |
| Finite-lived intangibles, net | $10.1M5 Dec 31, 2025 | $13.4M5 Dec 31, 2024 | −24.7% |
| Patents, net | $3.0M5 Dec 31, 2025 | $2.6M5 Dec 31, 2024 | +15.7% |
Inventory
Leadership
Who has led Camtek Ltd., and when. Pick a name to see everywhere that person has worked.
Chief executive
Chief financial officer
Chief operating officer
- Chief executive officerRafi Amit Apr 13, 2026 to now14
- Chief financial officerMoshe Eisenberg Apr 13, 2026 to now15
- Chief operating officerRam Langer Apr 13, 2026 to now16
Board members and other officers (8)
- Vice President, HROrit Geva-Dvash Apr 13, 2026 to now17
- Board memberArie Mordechay Ben Apr 13, 2026 to now18
- Board memberIshih Tseng Apr 13, 2026 to now19
- Board memberKarni Yarl Andorn Apr 13, 2026 to now20
- Board memberLior Aviram Apr 13, 2026 to now21
- Board memberOrit Stav Apr 13, 2026 to now22
- Board memberYosef Shacham Apr 13, 2026 to now23
- Board memberYotam Stern Apr 13, 2026 to now24
Timeline
Calendar
Coming up
- Nov 9, 2026Reports results for the quarter ending Sep/2026 A year earlier it reported $0.72 a share, on Nov 10, 2025.25
Upcoming dates from Nasdaq's calendar; past results from the company's 8-K filings (Item 2.02). The full markets calendar
Filings
185 filings to the SEC since October 2021: 5 annual reports, 23 insider forms, 16 large holders, 141 other. The latest 20:
- Oct 14, 20266-K EDGAR
- Oct 14, 20266-K EDGAR
- Aug 18, 20264 PRIMARY DOCUMENT EDGAR
- Aug 18, 2026144 EDGAR
- Aug 17, 20264 PRIMARY DOCUMENT EDGAR
- Aug 17, 20264 PRIMARY DOCUMENT EDGAR
- Aug 17, 20264 PRIMARY DOCUMENT EDGAR
- Aug 17, 2026144 EDGAR
- Aug 14, 2026144 EDGAR
- Aug 14, 2026144 EDGAR
- Aug 14, 2026144 EDGAR
- Aug 13, 20264 PRIMARY DOCUMENT EDGAR
- Aug 13, 20264 PRIMARY DOCUMENT EDGAR
- Aug 13, 20264 PRIMARY DOCUMENT EDGAR
- Aug 13, 2026144/A EDGAR
- Aug 13, 2026144 EDGAR
- Aug 13, 2026144 EDGAR
- Aug 12, 2026144 EDGAR
- Aug 12, 2026144 EDGAR
- Aug 11, 2026SCHEDULE 13G EDGAR
The 185 filings since October 2021 can be filtered by form type and year here when JavaScript is on.
Every filing from the last five years, summarized. The full record is on SEC EDGAR.
Insider trades
10 open-market trades by officers, directors and large owners since October 2021: 0 buys and 10 sales. Grants, option exercises and gifts are left out.
| Date | Who | Trade | Shares | Price | Value | Filing |
|---|---|---|---|---|---|---|
| Aug 17, 2026 | Geva-Dvash OritVice President, HR | Sale | 508 | $175.00 | $88.9K | Form 4 |
| Aug 14, 2026 | Andorn Karni YarlDirector | Sale | 3,176 | $164.40 | $522.1K | Form 4 |
| Aug 13, 2026 | Andorn Karni YarlDirector | Sale | 2,356 | $172.35 | $406.1K | Form 4 |
| Aug 13, 2026 | Langer RamChief Operating Officer | Sale | 6,387 | $172.32 | $1.1M | Form 4 |
| Aug 13, 2026 | AMIT RAFIChief Executive Officer | Sale | 6,250 | $170.52 | $1.1M | Form 4 |
| Aug 12, 2026 | Geva-Dvash OritVice President, HR | Sale | 415 | $174.06 | $72.2K | Form 4 |
| Aug 12, 2026 | Aviram LiorDirector | Sale | 3,347 | $173.87 | $581.9K | Form 4 |
| Aug 12, 2026 | Eisenberg MosheChief Financial Officer | Sale | 645 | $172.67 | $111.4K | Form 4 |
| Aug 11, 2026 | Aviram LiorDirector | Sale | 3,347 | $162.99 | $545.5K | Form 4 |
| Aug 11, 2026 | Eisenberg MosheChief Financial Officer | Sale | 3,759 | $160.06 | $601.7K | Form 4 |
From Forms 4 filed with the SEC.
Major holders
Investors who own more than 5% of the shares must tell the SEC: a 13D if they may seek to influence the company, a 13G if they hold passively.
- Phoenix Financial Ltd.SCHEDULE 13G, 3 filings May 30, 2023 to Aug 11, 202626
- Migdal Insurance & Financial Holdings Ltd.SCHEDULE 13G/A, 5 filings Feb 2, 2022 to Jul 23, 202627
- WASATCH ADVISORS LPSCHEDULE 13G/A, 6 filings May 13, 2025 to Jul 9, 202628
- Harel Insurance Investments & Financial Services Ltd.SCHEDULE 13G/A, 2 filings Dec 23, 2025 to May 5, 202629
SEC filer profile
How Camtek Ltd. is registered with the Securities and Exchange Commission, from its EDGAR record and the cover page of its latest annual report.
- Name on EDGARCAMTEK LTD2
- CIK0001109138
- Filer statusLarge accelerated filer not an emerging growth company; not a shell company7
- Incorporated inIsrael7
- Fiscal year endsDecember 312
- Industry code (SIC)3827 Optical Instruments & Lenses2
- SEC reviewing officeOffice of Industrial Applications and Services, Division of Corporation Finance2
- Business addressIndustrial Zone, Po Box 544, Migdal Haemek, Israel2
- Phone972-4-604-81002
- Shares outstanding45,828,133 shares as of Dec 31, 20257
- AuditorSomekh Chaikin, Tel Aviv, Israel PCAOB ID 1057; it also attests to the company’s internal control over financial reporting7
- On EDGAR sinceJul 21, 20002
- Filings730 in all: 6-K (473), 144 (51), 20-F (26), UPLOAD (19), CORRESP (16), SC 13G/A (13), SD (13), 3 (12)2
All 31 form types
4 (11), S-8 (11), SC 13G (11), 6-K/A (8), SC 13D/A (7), SCHEDULE 13G/A (7), EFFECT (6), F-1/A (6), F-3 (6), 424B3 (5), 424B5 (5), 20-F/A (4), F-3/A (4), SCHEDULE 13G (4), 144/A (2), 424B1 (2), SC 13D (2), 8-A12G (1), D (1), DEF 14A (1), F-1 (1), POS AM (1), RW (1)
- Latest filingsAnnual report (20-F) Mar 19, 2026
Proxy statement (DEF 14A) Nov 30, 2000
Securities registered for trading
| Class | Symbol | Exchange |
|---|---|---|
| Ordinary Shares, nominal value NIS 0.01 per share | CAMT | Nasdaq |
From the cover page of the 20-F filed Mar 19, 2026 (Section 12(b) of the Exchange Act).7
Links
- Websitewww.camtek.com1
- Websitewww.camtek.com1
- WikidataQ61125462
- SEC EDGARCIK 1109138
Sources
The numbers on this page point here. Each one links to the record it came from.
- 1WikidataCamtek Ltd. on Wikidata
- 2SEC EDGARCamtek Ltd. filings on SEC EDGAR
- 3
- 4Company websiteCamtek Ltd. logo
- 5SEC EDGARCamtek Ltd. 10-K for fiscal 2025
- 6SEC EDGARCamtek Ltd. filings on SEC EDGAR
- 7
- 8SEC EDGARCamtek Ltd. 10-K for fiscal 2018
- 9SEC EDGARCamtek Ltd. 10-K for fiscal 2019
- 10SEC EDGARCamtek Ltd. 10-K for fiscal 2020
- 11SEC EDGARCamtek Ltd. 10-K for fiscal 2021
- 12SEC EDGARCamtek Ltd. 10-K for fiscal 2022
- 13SEC EDGARCamtek Ltd. 10-K for fiscal 2018
- 14SEC EDGARRafi Amit, Chief executive officer
- 15
- 16SEC EDGARRam Langer, Chief operating officer
- 17SEC EDGAROrit Geva-Dvash, Vice President, HR
- 18SEC EDGARArie Mordechay Ben, Board member
- 19SEC EDGARIshih Tseng, Board member
- 20SEC EDGARKarni Yarl Andorn, Board member
- 21SEC EDGARLior Aviram, Board member
- 22SEC EDGAROrit Stav, Board member
- 23SEC EDGARYosef Shacham, Board member
- 24SEC EDGARYotam Stern, Board member
- 25NasdaqNasdaq calendar
- 26
- 27
- 28
- 29