FutureFuel Corporation is a developer and producer of chemicals and biofuels. It is listed on the New York Stock Exchange, with symbol FF.3 It is headquartered in United States.1Wikipedia text CC BY-SA 4.0
Outside the United States$952.0K81%up 46% from 2024
Regions by year
Regions
2023
2024
2025
United States
$367.4M
$242.7M
$94.8M
Outside the United States
$882.0K
$654.0K
$952.0K
Where the money goes
Where each dollar of revenue went, fiscal 2025
Other costs
Research and development4¢$3.9M
Selling, general and admin10¢$9.7M
Other costs86¢$82.0M
Income tax0¢$165.0K
Out of $95.7M in revenue.8 The company lost money this year.
Financial statements
Revenue91011128$95.7M in 2025−53% since 2019Gross profit91011128-$39.4M in 2025Operating income91011128-$53.0M in 2025Net income91011128-$49.4M in 2025
Revenue1314$78.7M in Q2 FY2026+146% since Q1 FY2026Gross profit1314$15.0M in Q2 FY2026Operating income1314$11.3M in Q2 FY2026Net income1314$11.4M in Q2 FY2026
Every line of the income statement as filed: the last 3 fiscal years, latest first.8
Period ending
2025-12-31
2024-12-31
2023-12-31
Revenue
$95.7M
$243.3M
$368.2M
Gross (loss) profit
-$39.4M
$19.6M
$41.0M
Compensation expense
$5.6M
$4.8M
$4.5M
Other expense
$3.5M
$3.8M
$4.1M
Related party expense
$674.0K
$632.0K
$616.0K
Research and development expenses
$3.9M
$4.0M
$4.4M
Total operating expenses
$13.6M
$13.3M
$13.6M
(Loss) income from operations
-$53.0M
$6.4M
$27.4M
Interest and dividend income
$3.9M
$7.7M
$9.6M
Interest expense
-$153.0K
-$138.0K
-$138.0K
Gain on marketable securities
$0
$0
$575.0K
Other income, net
$0
$2.4M
$1.0K
Other income
$3.8M
$9.9M
$10.0M
(Loss) income before income taxes
-$49.2M
$16.3M
$37.4M
Income tax provision
$165.0K
$792.0K
$1.0K
Basic (in dollars per share)
-$1.13
$0.35
$0.85
Diluted (in dollars per share)
-$1.13
$0.35
$0.85
Basic (in shares)
43.9M shares
43.8M shares
43.8M shares
Diluted (in shares)
43.9M shares
43.8M shares
43.8M shares
Net (loss) income
-$49.4M
$15.5M
$37.4M
Other comprehensive income (loss) from unrealized net losses on available-for- sale debt securities
$0
$0
$2.0K
Income tax effect
$0
$0
-$1.0K
Total unrealized gain (loss), net of tax
$0
$0
$1.0K
Comprehensive (loss) income
-$49.4M
$15.5M
$37.4M
No quarter-by-quarter statement was filed.
Total assets1591011128$192.2M in 2025−67% since 2019Total liabilities1591011128$37.5M in 2025−69% since 2019Shareholders’ equity1011128$154.7M in 2025−67% since 2019Cash1591011128$51.3M in 2025−79% since 2019
Total assets1314$215.0M in Q2 FY2026+7% since Q1 FY2025Total liabilities1314$62.0M in Q2 FY2026+64% since Q1 FY2025Shareholders’ equity1314$153.1M in Q2 FY2026−6% since Q1 FY2025Cash1314$34.4M in Q2 FY2026−33% since Q1 FY2025
Every line of the balance sheet as filed: the last 4 fiscal years (annual) or 4 quarters (quarterly), latest first.8
Period ending
2025-12-31
2024-12-31
2023-12-31
2022-12-31
Cash and cash equivalents
$51.3M
$109.5M
Accounts receivable, inclusive of the blenders tax credit of $0 and $6,683, and net of allowances for credit losses of $28 and $29, respectively
$9.4M
$21.9M
Inventory, net
$21.3M
$20.6M
Income tax receivable
$88.0K
$53.0K
Other current assets
$14.4M
$8.7M
Total current assets
$100.5M
$164.8M
Property, plant and equipment, net
$86.8M
$78.5M
Other noncurrent assets
$4.9M
$4.4M
Total noncurrent assets
$91.7M
$82.9M
Total Assets
$192.2M
$247.7M
Deferred revenue current
$1.7M
$904.0K
Dividends payable-current
$2.8M
$10.7M
Accrued expenses and other current liabilities
$2.6M
$11.1M
Total current liabilities
$17.7M
$33.3M
Deferred revenue noncurrent
$14.5M
$6.3M
Dividends payable -noncurrent
$196.0K
$0
Noncurrent deferred income taxes
$910.0K
$773.0K
Other noncurrent liabilities
$4.2M
$1.5M
Total noncurrent liabilities
$19.8M
$8.6M
Total liabilities
$37.5M
$41.9M
Preferred stock
$0
$0
Common stock, $0.0001 par value, 75,000,000 shares authorized, 43,863,507 and 43,803,243 issued and outstanding as of December 31, 2025 and 2024, respectively
$4.0K
$4.0K
Additional paid in capital
$203.8M
$205.4M
Retained earnings (accumulated deficit)
-$49.1M
$383.0K
Total stockholders equity
$154.7M
$205.8M
$309.9M
$283.0M
Total Liabilities and Stockholders Equity
$192.2M
$247.7M
Allowance for bad debt
$28.0K
$29.0K
Accounts receivable, tax credits
$0
$6.7M
$11.4M
Preferred stock, par value (in dollars per share)
$0.00
$0.00
Preferred stock, shares authorized (in shares)
5.0M shares
5.0M shares
Preferred stock, shares issued (in shares)
0 shares
0 shares
Preferred stock, shares outstanding (in shares)
0 shares
0 shares
Common stock, par value (in dollars per share)
$0.00
$0.00
Common stock, shares authorized (in shares)
75.0M shares
75.0M shares
Common stock, shares issued (in shares)
43.9M shares
43.8M shares
Common stock, shares outstanding (in shares)
43.9M shares
43.8M shares
Cash from operations91011128-$28.7M in 2025Capital spending91011128$17.2M in 2025+147% since 2019Free cash flow91011128-$46.0M in 2025Dividends paid91011128$10.5M in 2025+0% since 2019
Cash flow is reported year to date, not quarter by quarter, so there are no separate quarterly figures.
Every line of the cash flow as filed: the last 3 fiscal years, latest first.8
Period ending
2025-12-31
2024-12-31
2023-12-31
Net (loss) income
-$49.4M
$15.5M
$37.4M
Depreciation
$9.7M
$9.2M
$10.3M
Amortization of deferred financing costs
$82.0K
$103.0K
$101.0K
(Benefit) provision for deferred income taxes
$137.0K
$773.0K
$0
Change in fair value of equity securities
$0
$0
-$3.1M
Change in fair value of derivative instruments
-$221.0K
$2.0M
-$1.9M
Loss on the sale of investments
$0
$0
$2.5M
Stock based compensation
$1.0M
$359.0K
$0
(Gain) loss on disposal of property, plant, and equipment
-$34.0K
$30.0K
$29.0K
Noncash interest expense
$36.0K
$35.0K
$34.0K
Accounts receivable
$12.5M
$6.5M
-$2.2M
Accounts receivable related parties
$0
$1.0K
$5.0K
Inventory
-$611.0K
$4.7M
-$4.4M
Income tax receivable
-$35.0K
$1.9M
$19.0K
Prepaid expenses
-$99.0K
$380.0K
-$652.0K
Other assets
-$4.4M
-$146.0K
-$935.0K
Accounts payable
-$519.0K
-$12.1M
-$6.5M
Accounts payable related parties
-$99.0K
$97.0K
-$7.8M
Dividends payable
$47.0K
$186.0K
$0
Accrued expenses and other current liabilities
-$8.5M
$6.3M
-$720.0K
Deferred revenue
$9.0M
-$9.2M
-$2.4M
Other noncurrent liabilities
$2.7M
-$1.9M
$1.5M
Net cash (used in) provided by operating activities
-$28.7M
$24.8M
$21.3M
Collateralization of derivative instruments
-$1.4M
-$132.0K
$1.3M
Proceeds from the sale of marketable securities
$0
$0
$37.7M
Proceeds from the sale of property, plant, and equipment
$34.0K
$6.0K
$0
Capital expenditures
-$17.2M
-$14.7M
-$6.0M
Net cash (used in) provided by investing activities
-$18.6M
-$14.8M
$33.0M
Deferred financing costs
-$376.0K
$0
-$14.0K
Payment of dividends
-$10.5M
-$119.9M
-$10.5M
Net cash used in financing activities
-$10.9M
-$119.9M
-$10.5M
Net change in cash and cash equivalents
-$58.2M
-$109.9M
$43.8M
Cash paid for interest
$71.0K
$0
$0
Cash paid for income taxes
$27.0K
$457.0K
$20.0K
Noncash capital expenditures included in accounts payable
FutureFuel sits at the top of its group. 1 entity, 1 country on record. Switch between the flow chart and the network, and select any entity to see its details.
Major holders of FutureFuel
DIMENSIONAL FUND ADVISORS LPFiled SCHEDULE 13G/A on FutureFuel, latest Oct 9, 2025 (6 filings since Feb 8, 2022)
BlackRockFiled SC 13G/A on FutureFuel, latest Feb 7, 2024 (5 filings since Jan 28, 2022)
Paul A. NovellyFiled SC 13D/A on FutureFuel, latest Jun 21, 2022
Built from parent and subsidiary links from GLEIF, the Global Legal Entity Identifier Foundation (CC0); major holders from Schedules 13D and 13G. Each entity in the chart links to its source.
What it owns
What FutureFuel reports owning in its annual reports to the SEC: buildings, land and equipment, real estate and locations, investments, intangible assets and inventory, at the end of its latest fiscal year and a year before.
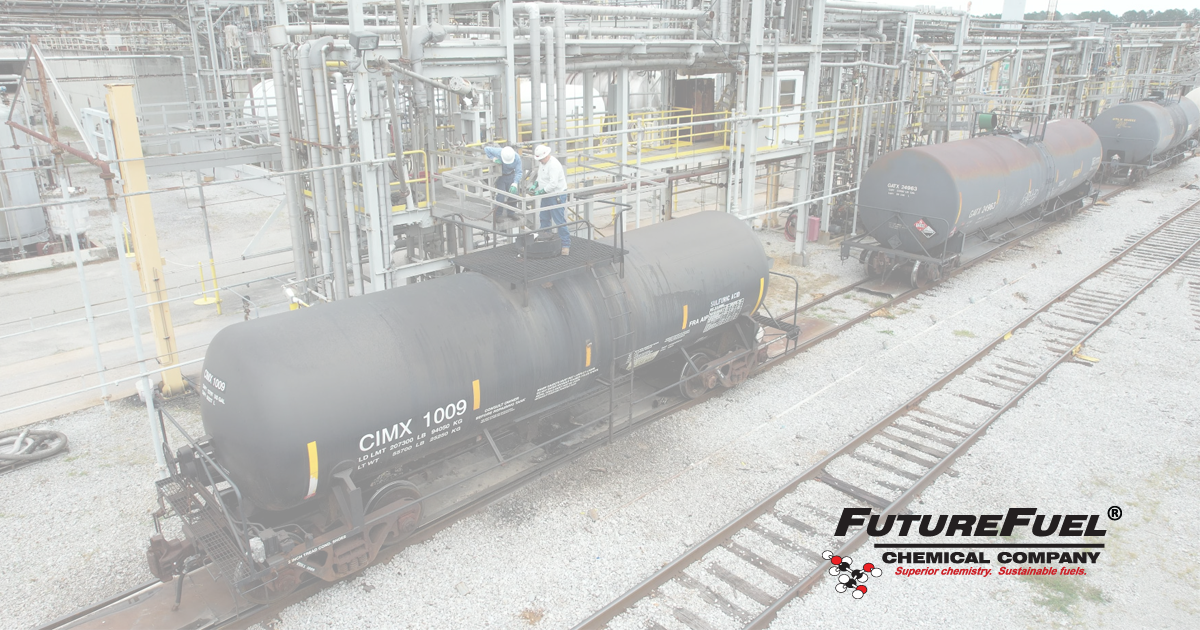
Our principal asset is a manufacturing plant situated on approximately 2,200 acres of land six miles southeast of Batesville in north central Arkansas fronting the White River. Approximately 500 acres of the site are occupied with batch and continuous manufacturing facilities, laboratories, and infrastructure, including on-site liquid waste treatment. Our subsidiary, FutureFuel Chemical Company, is the fee owner of this plant and the land upon which it is situated (which plant and land are not subject to any major encumbrances) and manufactures both biofuels and chemicals at the plant. Use of these facilities may vary with product mix and economic, seasonal, and other business conditions, but the plant is substantially used with the exception of facilities designated for capacity expansion of biodiesel. The plant, including approved expansions, has sufficient capacity for existing needs and expected near-term growth. We believe that the plant is well maintained, in good operating condition, and suitable and adequate for its uses.
In 2005 the company was founded in Clayton, Missouri as Viceroy Acquisition Corp., a Special-purpose acquisition company. In 2006 Viceroy acquired a plant in Batesville, Arkansas from Eastman Chemical and subsequently changed its name to FutureFuel. Lee Mikles was CEO from 2006 until 2013. Since 2013 Tony Novelly has been chairman and CEO.
The company operates in two segments: chemicals and biofuels.
The company has a wholly owned subsidiary named FutureFuel Chemical Company, which develops various chemical products selling to third party customers. The chemical segment consists of two components, which are custom manufacturing that produce chemicals for specific customers, and performance multi-customer specialty chemicals. During 2011, about 50% of the company's revenue came from manufacturing specialty chemicals.
The biofuel segment mainly produce biodiesel, as well as petrodiesel. This operation segment is in central Arkansas, where the company owns 2,200 acres of land six miles southeast of Batesville, Arkansas.
Upcoming dates from Nasdaq's calendar; past results from the company's 8-K filings (Item 2.02). The full markets calendar
Filings
184 filings to the SEC since October 2021: 6 annual reports, 17 quarterly reports, 78 major events, 59 insider forms, 15 large holders, 9 other. The latest 20:
18 open-market trades by officers, directors and large owners since October 2021: 17 buys and 1 sales. Grants, option exercises and gifts are left out.
What the company paid its top executives, from the summary compensation table in its proxy statement. Total pay includes salary, bonus, stock and option awards and other pay, as the company valued them.
The largest holders among investment managers' 13F reports for the quarter ending Jun 30, 2026, the top 25 of 100. Change is in shares since the quarter before.
From the cover page of the 10-K filed Mar 16, 2026 (Section 12(b) of the Exchange Act).16
Risk factors and legal proceedings
The risks FutureFuel names in Item 1A of its 10-K filed Mar 16, 2026: 36 risks under these headings, as written.16
Risks Related to Economic Conditions, Governmental Action, and our Industry
Our industry is greatly influenced by the U.S. and overall global economy and as such adverse economic conditions have the potential to adversely affect our business, results of operations, or financial condition.
We operate within the biomass-based diesel industry, which is significantly influenced by governmental programs requiring or incentivizing the consumption of biofuels, including the BTC and CFPC. The expiration or loss of mandates or incentives would have a material adverse effect on our business.
Our biofuels operations may be harmed if federal or state governments were to change current laws and regulations.
We have historically derived a significant portion of our revenues from sales of our biofuels in the State of California primarily as a result of California’s LCFS; adverse changes in this law or reductions in the value of LCFS credits would harm our revenues and profits.
The industries in which we compete are highly competitive.
Fluctuations in commodity prices may cause a reduction in the demand or profitability of the products or services we produce.
We are reliant on certain strategic raw materials for our operations.
Market conditions or transportation impediments may hinder access to raw goods and distribution markets.
Concerns regarding the environmental impact of biodiesel production could affect public policy, which could impair our ability to operate at a profit and substantially harm our revenues and operating margins.
Climate change regulations may impact our ability to operate at a profit and harm our operating margins.
Growth in the sale and distribution of biodiesel is dependent on the expansion of related infrastructure, which may not occur on a timely basis, if at all, and our operations could be adversely affected by infrastructure limitations or disruptions.
The other 25 risks
Nitrogen oxide emissions from biodiesel may harm its appeal as a renewable fuel and increase costs.
Risks Related to our Business
We are exposed to operating risks.
We are reliant upon a relatively small number of customers.
Changes in technology may render our products or services obsolete.
Failure to comply with governmental regulations could result in the imposition of penalties, fines or restrictions on operations and remedial liabilities.
Our insurance may not protect us against our business and operating risks.
We depend on key personnel, the loss of any of whom could materially adversely affect our future operations.
If we are unable to effectively manage the commodity price risk of our raw materials or finished goods, we may have unexpected losses.
Currently, there is a supply disruption in the renewable fuel market as proposed regulations are finalized on the CFPC. However, under normal conditions there is excess renewable fuel production capacity and low utilization in the industry and if non-operational and underused facilities commence or increase operations, our results of operations may be negatively affected.
We are subject to industry and economic conditions that have caused several biofuel companies throughout the United States to file for bankruptcy over the last several years.
If we are unable to acquire or renew permits and approvals required for our operations, we may be forced to suspend or cease operations altogether.
Our indebtedness may limit our ability to borrow additional funds or capitalize on acquisition or other business opportunities.
We expect to have capital expenditure requirements, and we may be unable to obtain needed financing on satisfactory terms due to inflation and increased interest rates.
We may be unable to successfully integrate future acquisitions with our operations or realize all of the anticipated benefits of such acquisitions.
If we are unable to respond to changes in ASTM or customer standards, our ability to sell biodiesel may be harmed.
If we fail to maintain effective internal control over financial reporting, we might not be able to report our financial results accurately or prevent fraud; in that case, our stockholders could lose confidence in our financial reporting, which would harm our business and could negatively impact the value of our stock.
The risk of loss of the Company’s intellectual property, trade secrets or other sensitive business information or disruption of operations could negatively impact the Company’s financial results.
Risks Related to Emerging Technologies and Artificial Intelligence
Confidentiality agreements with customers, employees, and others may not adequately prevent disclosures of confidential information, trade secrets, and other proprietary information.
We depend on our ability to maintain relationships with industry participants, including our strategic partners.
We are exposed to government credit risk and fluctuations in market values of our cash and cash equivalent portfolio.
Risks Associated with Owning Our Shares
We may issue substantial amounts of additional shares without stockholder approval.
The market price of our common stock is highly volatile and may increase or decrease dramatically at any time.
If securities or industry analysts issue an adverse or misleading opinion regarding our stock or do not publish research or reports about our business, our stock price and trading volume could decline.
If Mr. P.A. Novelly, II or his designees exercises his registration rights, such exercise may have an adverse effect on the market price of our shares of common stock.
We may be suspended or delisted from the New York Stock Exchange if we do not satisfy their continued listing requirements.
Legal proceedings
We are not a party to, nor is any of our property subject to, any material pending legal proceedings, other than ordinary routine litigation incidental to our business. From time to time, we may be parties to, or targets of, lawsuits, claims, investigations, and proceedings, including product liability, personal injury, asbestos, patent and intellectual property, commercial, contract, environmental, antitrust, health and safety, and employment matters, which we expect to be handled and defended in the ordinary course of business. While we are unable to predict the outcome of any matters currently pending, we do not believe that the ultimate resolution of any such pending matters will have a material adverse effect on our overall financial condition, results of operations, or cash flows.