

LNG on NYSE

Cheniere Energy

Logo: cheniere.com6

American liquified natural gas company

Cheniere Energy, Inc. is an American liquefied natural gas (LNG) company headquartered in Houston, Texas. In February 2016 it became the first American company to export liquefied natural gas. Cheniere Energy is the largest exporter of LNG in the United States and the second-largest LNG producer globally as of 2024.3 Its revenue was $33.4 billion in 2022.1 Wikipedia text CC BY-SA 4.0

$288.99 up 9.84 (3.52%)Price as of Oct 16, 2026 at 19:58 UTC

Last updated Oct 21, 2026.

Overview

1996Founded1

Compare with Venture Global, Inc., Cheniere Energy Partners, L.P. or Atmos Energy, or pick any stock.

  • TickerLNG on NYSE1
  • IndustryNatural Gas Distribution1
  • HeadquartersHouston1
  • Websitewww.cheniere.com
  • Legal formDelaware corporation1
  • Incorporated inDE7
  • Business address845 Texas Avenue, Suite 1250, Houston, Tx 770027
  • Filer categoryLarge accelerated filer7
  • LEIMIHC87W9WTYSYZWV1J404
  • StatusActive4
  • LEI statusIssued and current4
  • Registered addressC/O CORPORATION SERVICE COMPANY, 19808 Wilmington, United States4
  • Registered withDivision of Corporations, Department of State, 20055094
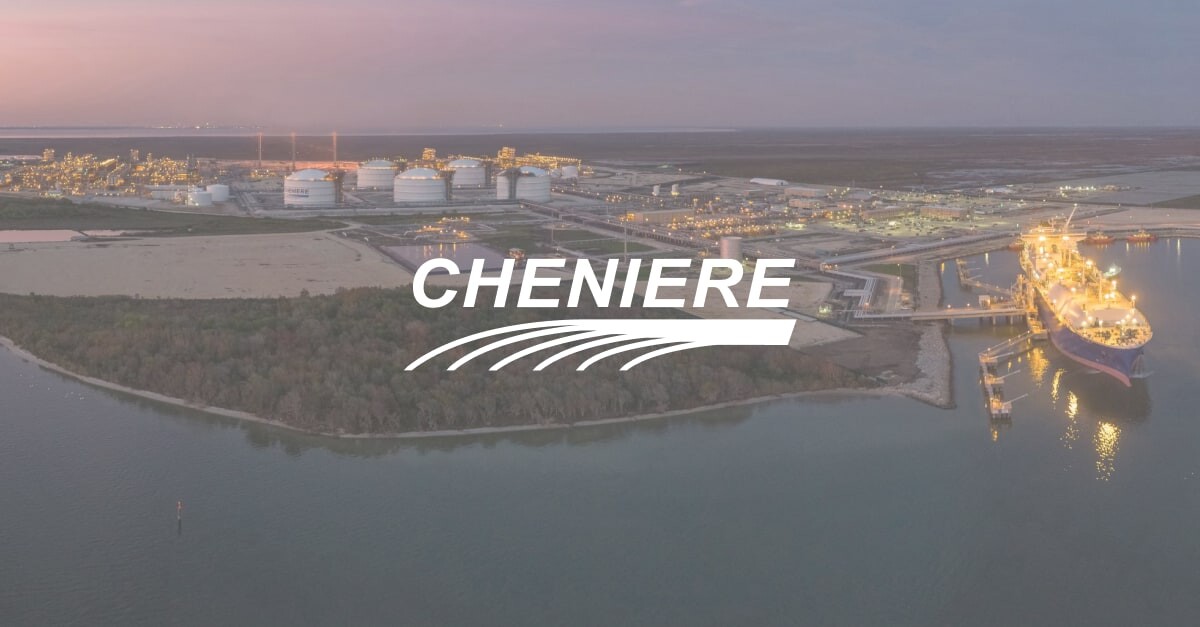
Cheniere Energy image from its website
Image: cheniere.com6

Cheniere Energy, Inc. is an American liquefied natural gas (LNG) company headquartered in Houston, Texas.3

Financials

From the company’s reports to the SEC. Every number links to the filing it came from.

Key numbers, fiscal 2025

46.8%Operating margin13
27.4%Net margin13
26.3%Revenue growth, 202513
67.3%Return on equity13
2.84×Debt to equity13
$2.5BFree cash flow13

What sells

Revenue by product, business segment and region, as the company reports it to the SEC.

Products and services

Liquefied Natural Gas brought in 97% of the revenue Cheniere Energy broke down this way in fiscal 2025.

  1. Liquefied Natural Gas$19.1B1397%up 28% from 2024
  2. Product and Service, Other$237.0M131%down 23% from 2024
  3. Liquefied Natural Gas Procured From Third Parties$226.0M131%down 19% from 2024
  4. Regasification Service$136.0M131%up 1% from 2024
Products and services by year
Products and services202320242025
Liquefied Natural Gas$19.5B$15.0B$19.1B
Product and Service, Other$187.0M$307.0M$237.0M
Liquefied Natural Gas Procured From Third Parties$359.0M$280.0M$226.0M
Regasification Service$135.0M$135.0M$136.0M

Where the money goes

Where each dollar of revenue went, fiscal 2025

  • Selling, general and admin2¢$383.0M
  • Other costs63¢$12.3B
  • Income tax8¢$1.5B
  • Profit27¢$5.3B

Out of $19.5B in revenue.13

Where each dollar of operating cash went, fiscal 2025

  • Capital spending49¢$3.1B
  • Dividends paid7¢$451.0M
  • Share buybacks44¢$2.7B

Out of $5.5B of cash from operations. Spending exceeded cash from operations; the rest came from savings or borrowing.13

Financial statements

Revenue1415161713$19.5B in 2025+113% since 2019
0$10.0B$20.0B$30.0B$40.0B2019: $9.2B$9.2B20192020: $9.3B$9.3B2020+1%2021: $17.5B$17.5B2021+89%2022: $33.3B$33.3B2022+90%2023: $19.8B$19.8B2023−41%2024: $15.4B$15.4B2024−22%2025: $19.5B$19.5B2025+26%
Operating income1415161713$9.1B in 2025+286% since 2019
-$5.0B0$5.0B$10.0B$15.0B$20.0B2019: $2.4B$2.4B20192020: $2.6B$2.6B2020+11%2021: -$701.0M-$701.0M20212022: $4.6B$4.6B20222023: $15.5B$15.5B2023+240%2024: $6.1B$6.1B2024−60%2025: $9.1B$9.1B2025+49%
Net income1415161713$5.3B in 2025+723% since 2019
-$5.0B0$5.0B$10.0B2019: $648.0M$648.0M20192020: -$85.0M-$85.0M20202021: -$2.3B-$2.3B2021+2656%2022: $1.4B$1.4B20222023: $9.9B$9.9B2023+592%2024: $3.3B$3.3B2024−67%2025: $5.3B$5.3B2025+64%

Every line of the income statement as filed: the last 3 fiscal years, latest first.13

Period ending2025-12-312024-12-312023-12-31
Revenues$20.0B$15.7B$20.4B
Cost of sales (excluding operating and maintenance expense and depreciation, amortization and accretion expense shown separately below)$7.2B$6.0B$1.4B
Operating and maintenance expense$2.0B$1.9B$1.8B
Selling, general and administrative expense$383.0M$441.0M$474.0M
Depreciation, amortization and accretion expense$1.3B$1.2B$1.2B
Other operating costs and expenses$36.0M$36.0M$44.0M
Total operating costs and expenses$10.9B$9.6B$4.9B
Income from operations$9.1B$6.1B$15.5B
Interest expense, net of capitalized interest-$948.0M-$1.0B-$1.1B
Gain (loss) on modification or extinguishment of debt-$8.0M-$9.0M$15.0M
Interest and dividend income$106.0M$189.0M$211.0M
Other income, net$20.0M$5.0M$4.0M
Total other expense-$830.0M-$825.0M-$911.0M
Income before income taxes and NCI$8.3B$5.3B$14.6B
Less: income tax provision$1.5B$811.0M$2.5B
Net income$6.8B$4.5B$12.1B
Less: net income attributable to NCI$1.5B$1.2B$2.2B
Net income attributable to Cheniere$5.3B$3.3B$9.9B
Net income per share attributable to common stockholdersbasic (1)$24.19$14.24$40.99
Net income per share attributable to common stockholdersdiluted (1)$24.13$14.20$40.72
Weighted average number of common shares outstandingbasic219.7M shares228.4M shares241.0M shares
Weighted average number of common shares outstandingdiluted220.3M shares229.1M shares242.6M shares

Compare Cheniere Energy with another company

Corporate structure

Cheniere Energy sits at the top of its group. 54 entities, 3 countries on record. Switch between the flow chart and the network, and select any entity to see its details.

Major holders of Cheniere Energy

  • VANGUARD CAPITAL MANAGEMENT LLC Filed SCHEDULE 13G on Cheniere Energy, latest Apr 28, 2026
  • VANGUARD GROUP INC Filed SCHEDULE 13G/A on Cheniere Energy, latest Mar 26, 2026 (5 filings since Feb 9, 2022)
  • BlackRock Filed SC 13G/A on Cheniere Energy, latest Oct 24, 2024 (4 filings since Feb 1, 2022)
  • Carl C. Et Al Icahn Filed SC 13D/A on Cheniere Energy, latest Mar 8, 2022 (2 filings since Mar 1, 2022)
  • Cheniere Energy Houston, Texas, United States
    • Cheniere Corpus Christi Holdings, LLC Houston, Texas, United States
      • CHENIERE CORPUS CHRISTI PIPELINE, L.P. Subsidiary · Houston, Texas, United States
      • CORPUS CHRISTI LIQUEFACTION, LLC Subsidiary · Houston, Texas, United States
    • Cheniere Energy Partners, L.P. Houston, Texas, United States
    • Sabine Pass Liquefaction, LLC Houston, Texas, United States
    • CCL Midscale 8-9, LLC Subsidiary · Delaware, United States
    • Cheniere ADCC Investments, LLC Subsidiary · Delaware, United States
    • Cheniere CCH HoldCo I, LLC Subsidiary · Delaware, United States
    • Cheniere CCH HoldCo II, LLC Subsidiary · Delaware, United States
    • Cheniere Corpus Christi Pipeline, L.P. Subsidiary · Delaware, United States
    • CHENIERE CREOLE TRAIL PIPELINE, L.P. Subsidiary · Houston, Texas, United States
    • Cheniere Energy Investments, LLC Subsidiary · Delaware, United States
    • Cheniere Energy Operating Co., Inc. Subsidiary · Delaware, United States
    • Cheniere Energy Partners GP, LLC Subsidiary · Delaware, United States
    • Cheniere Energy Partners LP Holdings, LLC Subsidiary · Delaware, United States
    • Cheniere Energy Shared Services, Inc. Subsidiary · Delaware, United States
    • Cheniere Financial Services, LLC Subsidiary · Delaware, United States
    • Cheniere Foundation (fka Cheniere Cares, Inc.) Subsidiary · Texas, United States
    • Cheniere GP Holding Company, LLC Subsidiary · Delaware, United States
    • Cheniere Ingleside Marine Terminal, LLC Subsidiary · Delaware, United States
    • Cheniere Land Holdings, LLC Subsidiary · Delaware, United States
    • Cheniere Liquids, LLC Subsidiary · Delaware, United States
    • Cheniere LNG O&M Services, LLC Subsidiary · Delaware, United States
    • Cheniere LNG Terminals, LLC Subsidiary · Delaware, United States
    • Cheniere Logistics, LLC Subsidiary · Delaware, United States
    • Cheniere Low Carbon Ventures, LLC Subsidiary · Delaware, United States
    • Cheniere Major Project Development, LLC Subsidiary · Delaware, United States
    • and 25 more

Built from parent and subsidiary links from GLEIF, the Global Legal Entity Identifier Foundation (CC0); subsidiaries listed in Exhibit 21 of annual reports filed with the SEC; major holders from Schedules 13D and 13G. Each entity in the chart links to its source.

What it owns

What Cheniere Energy reports owning in its annual reports to the SEC: buildings, land and equipment, real estate and locations, investments, intangible assets and inventory, at the end of its latest fiscal year and a year before.

Property and equipment

ItemLatestA year beforeChange
Property and equipment, net$35.8B13 Dec 31, 2025$33.6B13 Dec 31, 2024+6.6%
Finance-lease assets$861.0M13 Dec 31, 2025$478.0M13 Dec 31, 2024+80.1%
Operating-lease assets (leased space)$2.7B13 Dec 31, 2025$2.7B13 Dec 31, 2024+0.6%

Investments

ItemLatestA year beforeChange
Cash and cash equivalents$1.1B13 Dec 31, 2025$2.6B13 Dec 31, 2024−58.3%
Stakes in other companies (equity method)$78.0M13 Dec 31, 2025$129.0M13 Dec 31, 2024−39.5%

Intangibles and goodwill

ItemLatestA year beforeChange
Goodwill$77.0M13 Dec 31, 2025$77.0M13 Dec 31, 20240%

Inventory

ItemLatestA year beforeChange
Inventory, total$524.0M13 Dec 31, 2025$501.0M13 Dec 31, 2024+4.6%

The story

Initially an oil-and-gas exploration company, the company shifted its focus in the early 2000s to developing liquified natural gas regas terminals, beginning with a terminal in Sabine Pass, Louisiana in March 2005. The company faltered in the late 2000s as LNG imports dried up due to international competition. In 2016 Cheniere founder Charif Souki was ousted after a dispute with investor Carl Icahn.

In the late 2010s, as natural gas production rose in the United States, the company grew significantly and in 2016 became an exporter of LNG to international markets.

Cheniere published its second annual corporate responsibility report in June 2021. Cheniere says it is taking innovative steps towards quantifying, monitoring, reporting and verifying data in partnership with producers and institutions in an effort to find opportunities to lower emissions.

In 2018 Cheniere Energy signed an agreement with CPC Corporation, Taiwan to supply liquefied natural gas for 25 years in a contract worth approximately US$25b. Deliveries to Taiwan are set to begin in 2021.

Cheniere and ENN Group reached a deal in 2021 which ENN would buy LNG from Cheniere. However, this deal was interrupted by the China–United States trade war before the parties came to a deal 20 year deal in 2023.

The company spends $800 million USD annually in pipeline transit fees to supply its expanding export facilities and is interested in constructing its own pipelines to access other pipelines and gas production fields.

In 2024, the CEO of Cheniere Energy, Jack Fusco, was in a meeting with Donald Trump where Trump promised to dismantle various environmental policies and climate mitigation efforts.

Liquefaction facilities

Through its subsidiaries, Cheniere Energy owns and operates two natural gas liquefaction and export facilities located in the United States: Sabine Pass LNG Terminal in Cameron Parish, Louisiana at Sabine Pass and Corpus Christi LNG Terminal near Corpus Christi, Texas.

Read the full text

On December 30, 2024, Cheniere Energy announced the successful production of the first liquefied natural gas from a new facility at its Corpus Christi LNG Terminal. This was an important step in the Corpus Christi Stage 3 expansion project, which commenced construction in mid-2022, led by its primary contractor, Bechtel Energy. The Corpus Christi Stage 3 expansion project is designed to increase the terminal's liquefied natural gas production capacity by an additional 10 million metric tonnes per annum. As of November 30, 2024, the overall project completion rate stood at 75.9%.

From Wikipedia’s article on Cheniere Energy, shared under CC BY-SA 4.0.8

Leadership

Who has led Cheniere Energy, and when. Pick a name to see everywhere that person has worked.

Board members and other officers (58)

Products and brands

  • liquefied natural gas

Listed on Wikidata.1

Subsidiaries and ownership

Also consolidated

Subsidiaries (Exhibit 21)

  • CCL Midscale 8-9, LLC Delaware9
  • Cheniere ADCC Investments, LLC Delaware9
  • Cheniere CCH HoldCo I, LLC Delaware9
  • Cheniere CCH HoldCo II, LLC Delaware9
  • Cheniere Corpus Christi Holdings, LLC Delaware9
  • Cheniere Corpus Christi Pipeline, L.P. Delaware9
  • Cheniere Creole Trail Pipeline, L.P. Delaware9
  • Cheniere Energy Investments, LLC Delaware9
  • Cheniere Energy Operating Co., Inc. Delaware9
  • Cheniere Energy Partners GP, LLC Delaware9
  • Cheniere Energy Partners LP Holdings, LLC Delaware9
  • Cheniere Energy Partners, L.P. Delaware9
  • Cheniere Energy Shared Services, Inc. Delaware9
  • Cheniere Financial Services, LLC Delaware9
  • Cheniere Foundation (fka Cheniere Cares, Inc.) Texas9
  • Cheniere GP Holding Company, LLC Delaware9
  • Cheniere Ingleside Marine Terminal, LLC Delaware9
  • Cheniere LNG O&M Services, LLC Delaware9
  • Cheniere LNG Terminals, LLC Delaware9
  • Cheniere Land Holdings, LLC Delaware9
  • Cheniere Liquids, LLC Delaware9
  • Cheniere Logistics, LLC Delaware9
  • Cheniere Low Carbon Ventures, LLC Delaware9
  • Cheniere Major Project Development, LLC Delaware9
All 53 listed subsidiaries
  • Cheniere Marketing Holdco, LLC Delaware9
  • Cheniere Marketing International, LLP United Kingdom9
  • Cheniere Marketing PTE Ltd. Singapore9
  • Cheniere Marketing, LLC Delaware9
  • Cheniere Marketing, Ltd. United Kingdom9
  • Cheniere Midship Holdings, LLC Delaware9
  • Cheniere Midstream Holdings, Inc. Delaware9
  • Cheniere Operating, LLC Delaware9
  • Cheniere Overseas Management Services Ltd United Arab Emirates9
  • Cheniere Pipeline GP Interests, LLC Delaware9
  • Cheniere Project Construction, LLC Delaware9
  • Cheniere SCM Holdings, LLC Delaware9
  • Corpus Christi Liquefaction Stage IV, LLC Delaware9
  • Corpus Christi Liquefaction, LLC Delaware9
  • Corpus Christi Pipeline GP, LLC Delaware9
  • Corpus Christi Tug Services, LLC Delaware9
  • GPIL Power Marketing, LLC Delaware9
  • Gregory Connector, LLC Delaware9
  • Gregory Power Investments, LLC Delaware9
  • Sabine Crossing Pipeline, LLC Delaware9
  • Sabine Pass Carbon Solutions, LLC Delaware9
  • Sabine Pass LNG, L.P. Delaware9
  • Sabine Pass LNG-GP, LLC Delaware9
  • Sabine Pass LNG-LP, LLC Delaware9
  • Sabine Pass Liquefaction Stage V, LLC Delaware9
  • Sabine Pass Liquefaction, LLC Delaware9
  • Sabine Pass Project Development, LLC Delaware9
  • Sabine Pass Tug Services, LLC Delaware9
  • Texas Gulf Coast Header, LLC Delaware9

Ownership links from GLEIF, the Global Legal Entity Identifier Foundation (CC0); each one cites its LEI record. The subsidiaries the company lists in Exhibit 21 of its annual report, as filed.

Former names

  • CHENIERE ENERGY INCNov 27, 1996 to Apr 15, 20197
  • BEXY COMMUNICATIONS INCJul 15, 1996 to Jun 13, 19967

Timeline

  1. Aug 6, 20268-K Results of operations89
  2. Jul 28, 20268-K Regulation FD disclosure90
  3. Jul 14, 20268-K Executive or director change; Regulation FD disclosure91
  4. Jul 2, 20268-K Entered a material agreement; New debt or obligation92
  5. Jun 9, 20268-K Entered a material agreement93
  6. May 27, 20268-K Entered a material agreement; Regulation FD disclosure94
  7. May 15, 20268-K Shareholder vote95
  8. May 7, 20268-K Results of operations96
  9. Apr 28, 20268-K Regulation FD disclosure97
  10. Apr 6, 20268-K Executive or director change98
  11. Mar 19, 20268-K Entered a material agreement; New debt or obligation99
  12. Mar 6, 20268-K Entered a material agreement; Regulation FD disclosure100
  13. May 16, 2016New chief executive Jack A. Fusco becomes CEO21
  14. Dec 22, 2015New chief executive Neal A. Shear becomes CEO22
  15. Dec 30, 2003New chief executive Charif Souki becomes CEO23
  16. 1996Founded Founded1

Calendar

Coming up

  1. Oct 29, 2026 · Before the openReports results for the quarter ending Sep/2026 A year earlier it reported $4.75 a share, on Oct 30, 2025.101

When it reported results

  1. Aug 6, 2026Reported quarterly or annual results89
  2. May 7, 2026Reported quarterly or annual results96
  3. Feb 26, 2026Reported quarterly or annual results102
  4. Oct 30, 2025Reported quarterly or annual results103
  5. Aug 7, 2025Reported quarterly or annual results104
  6. May 8, 2025Reported quarterly or annual results105
  7. Feb 20, 2025Reported quarterly or annual results106
  8. Oct 31, 2024Reported quarterly or annual results107

Upcoming dates from Nasdaq's calendar; past results from the company's 8-K filings (Item 2.02). The full markets calendar

Filings

328 filings to the SEC since October 2021: 5 annual reports, 15 quarterly reports, 91 major events, 161 insider forms, 12 large holders, 44 other. The latest 20:

  1. Sep 28, 2026SD EDGAR
  2. Sep 22, 2026EFFECT EDGAR
  3. Sep 22, 2026424B3 EDGAR
  4. Sep 2, 2026S-4 EDGAR
  5. Aug 18, 20264 EDGAR
  6. Aug 6, 20268-K EDGAR
  7. Aug 6, 202610-Q EDGAR
  8. Jul 28, 20268-K EDGAR
  9. Jul 16, 20263 EDGAR
  10. Jul 16, 20264 EDGAR
  11. Jul 14, 20268-K EDGAR
  12. Jul 2, 20268-K EDGAR
  13. Jun 9, 20268-K EDGAR
  14. May 27, 20268-K EDGAR
  15. May 15, 20264 EDGAR
  16. May 15, 20264 EDGAR
  17. May 15, 20264 EDGAR
  18. May 15, 20264 EDGAR
  19. May 15, 20264 EDGAR
  20. May 15, 20264 EDGAR

The 328 filings since October 2021 can be filtered by form type and year here when JavaScript is on.

Every filing from the last five years, summarized. The full record is on SEC EDGAR.

Insider trades

14 open-market trades by officers, directors and large owners since October 2021: 1 buys and 13 sales. Grants, option exercises and gifts are left out.

DateWhoTradeSharesPriceValueFiling
Mar 30, 2026Davis ZachEVP & CFOSale29,000$300.00$8.7MForm 4
Mar 27, 2026BOTTA G ANDREADirectorSale5,000$296.47$1.5MForm 4
Mar 26, 2026Feygin AnatolEVP & Chief Commercial OfficerSale40,432$290.98$11.8MForm 4
Mar 26, 2026Markowitz Sean NEVP, CLO and Corp SecSale22,246$290.98$6.5MForm 4
Mar 2, 2026SHEAR NEAL ADirectorSale4,100$248.71$1.0MForm 4
Nov 4, 2025MORELAND W BENJAMINDirectorBuy5,000$208.22$1.0MForm 4
Jun 5, 2025SHEAR NEAL ADirectorSale4,300$245.93$1.1MForm 4
Feb 27, 2025BOTTA G ANDREADirectorSale9,000$219.51$2.0MForm 4
Feb 26, 2025Feygin AnatolEVP & Chief Commercial OfficerSale23,478$216.43$5.1MForm 4
Jan 3, 2023BAILEY VICKY ADirectorSale2,700$141.50$382.1KForm 4
Aug 23, 2022Stephenson Aaron D.SVP, OperationsSale3,000$168.21$504.6KForm 4
Aug 18, 2022BOTTA G ANDREADirectorSale9,200$167.05$1.5MForm 4
Mar 31, 2022SHEAR NEAL ADirectorSale10,318$140.16$1.4MForm 4
Jan 3, 2022BAILEY VICKY ADirectorSale2,501$102.35$256.0KForm 4

From Forms 4 filed with the SEC.

Major holders

Investors who own more than 5% of the shares must tell the SEC: a 13D if they may seek to influence the company, a 13G if they hold passively.

Executive pay

What the company paid its top executives, from the summary compensation table in its proxy statement. Total pay includes salary, bonus, stock and option awards and other pay, as the company valued them.

YearExecutiveAgeSalaryTotal pay
2025Jack A. FuscoPresident and CEO63$1.8M$25.6M112
2025Zach DavisEVP and CFO41$861.5K$7.0M112
2025Anatol FeyginEVP and Chief Commercial Officer57$778.8K$6.3M112
2025Sean N. MarkowitzEVP, Chief Legal Officer and Corporate Secretary52$778.8K$6.3M112
2025Maas HinzSVP, Operations53$671.2K$4.8M112
2024Jack A. FuscoPresident and CEO63$1.7M$24.2M112
2024Zach DavisEVP and CFO41$785.6K$6.4M112
2024Anatol FeyginEVP and Chief Commercial Officer57$740.4K$6.0M112
2024Sean N. MarkowitzEVP, Chief Legal Officer and Corporate Secretary52$740.4K$6.0M112
2024Maas HinzSVP, Operations53$560.6K$4.2M112
2023Jack A. FuscoPresident and CEO63$1.6M$21.6M112
2023Zach DavisEVP and CFO41$710.6K$5.9M112
2023Sean N. MarkowitzEVP, Chief Legal Officer and Corporate Secretary52$695.2K$5.5M112
2023Anatol FeyginEVP and Chief Commercial Officer57$692.3K$5.5M112

Held by these funds

The largest holders among investment managers' 13F reports for the quarter ending Jun 30, 2026, the top 25 of 100. Change is in shares since the quarter before.

FundSharesValueShare of the fundChange
BlackRock, Inc.17,712,080$4.2B0.1%−140,003
Vanguard Portfolio Management LLC9,603,722$2.3B0.1%+279,077
Vanguard Capital Management LLC9,476,116$2.3B0.0%+325,827
State Street Corp5,938,476$1.4B0.0%−256,068
Fmr LLC4,938,766$1.2B0.1%+1,037,181
Morgan Stanley4,573,650$1.1B0.1%−635,476
Geode Capital Management, LLC3,717,072$885.8M0.0%−228,694
Norges Bank3,581,124$855.9M0.1%New
Jpmorgan Chase & Co3,109,949$758.7M0.0%−861,714
Canada Pension Plan Investment Board3,112,696$744.0M0.4%−961,833
Tortoise Capital Advisors, L.l.c.2,941,182$703.0M7.1%+383,398
Manufacturers Life Insurance Company, The2,633,763$629.5M0.5%−1,056,172
Massachusetts Financial Services Co /ma/2,559,742$617.6M0.2%−487,535
Royal Bank Of Canada2,520,022$602.3M0.1%−327,896
Wellington Management Group Llp2,444,403$584.2M0.1%+1,656,194
Goldman Sachs Group Inc2,357,818$563.5M0.1%+598,420
Dimensional Fund Advisors LP2,276,672$544.2M0.1%+138,531
D. E. Shaw & Co., Inc.2,161,262$516.6M0.3%+378,402
UBS AM, a distinct business unit of UBS ASSET MANAGEMENT AMERICAS LLC2,135,088$510.3M0.1%+239,680
Bank Of America Corp /de/2,132,339$509.7M0.0%−452,154
Bank of New York Mellon Corp2,100,394$502.0M0.1%−143,874
Millennium Management LLC2,069,180$494.6M0.3%+617,915
Invesco Ltd.2,048,648$489.6M0.0%−10,468
Neuberger Berman Group LLC1,934,884$462.5M0.3%−117,393
Nuveen, LLC1,920,586$459.0M0.1%−353,706

13F reports cover disclosed long positions in U.S. stocks only.

Members of Congress who traded it

14 trades disclosed by members of Congress. “Vs S&P since” is the stock’s change since the trade minus the S&P 500’s.

DateMemberTradeAmountVs S&P sinceFiling
Dec 12, 2025Josh GottheimerDemocratic, HouseSale$1,001 - $15,000−34.2%Report
May 12, 2025Jefferson ShreveRepublican, HouseSale$15,001 - $50,000+11.3%Report
Apr 22, 2025Josh GottheimerDemocratic, HouseBuy$1,001 - $15,000−24.9%Report
Apr 7, 2025Jefferson ShreveRepublican, HousePartial sale$15,001 - $50,000+15.0%Report
Oct 15, 2024Greg LandsmanDemocratic, HouseSale$1,001 - $15,000−18.8%Report
Feb 1, 2024Josh GottheimerDemocratic, HouseSale$1,001 - $15,000−13.5%Report
Sep 19, 2023Greg LandsmanDemocratic, HouseBuy$1,001 - $15,000−1.6%Report
May 19, 2023Josh GottheimerDemocratic, HousePartial sale$1,001 - $15,000−13.4%Report
May 16, 2023Maria Elvira SalazarRepublican, HouseSale$50,001 - $100,000−7.3%Report
Oct 13, 2022Josh GottheimerDemocratic, HouseBuy$1,001 - $15,000−54.2%Report
Apr 15, 2020David A Perdue , Jr, SenateSale$15,001 - $50,000−426.0%Report
Mar 26, 2020David A Perdue , Jr, SenateBuy$1,001 - $15,000+508.5%Report
Feb 19, 2020David A Perdue , Jr, SenatePartial sale$1,001 - $15,000−276.2%Report
Dec 16, 2019David A Perdue , Jr, SenateBuy$1,001 - $15,000+214.4%Report

Members report amounts as ranges, not exact figures. Returns are price-only (no dividends).

SEC filer profile

How Cheniere Energy is registered with the Securities and Exchange Commission, from its EDGAR record and the cover page of its latest annual report.

  • Name on EDGARCheniere Energy, Inc.2
  • CIK0000003570
  • Employer ID (EIN)95-4352386113
  • Filer statusLarge accelerated filer not an emerging growth company; not a smaller reporting company; not a shell company113
  • Incorporated inDelaware113
  • Fiscal year endsDecember 312
  • Industry code (SIC)4924 Natural Gas Distribution2
  • SEC reviewing officeOffice of Energy & Transportation, Division of Corporation Finance2
  • Business address845 Texas Avenue, Suite 1250, Houston, TX 770022
  • Phone71337550002
  • Shares outstanding206,534,158 as of Jul 31, 202619
  • Public float$53.6B as of Jun 30, 2025113
  • AuditorKPMG LLP, Houston, Texas PCAOB ID 185; it also attests to the company’s internal control over financial reporting113
  • On EDGAR sinceJun 3, 19962
  • Filings2,604 in all: 4 (1,209), 8-K (612), SC 13G/A (94), 10-Q (90), 3 (66), SC 13D/A (50), SC 13G (45), DEF 14A (35)2
    All 60 form types

    UPLOAD (34), 10-K (30), CORRESP (27), CT ORDER (23), IRANNOTICE (21), 4/A (19), 424B3 (19), 10-Q/A (17), 10-K/A (14), PRE 14A (14), S-8 (14), 144 (13), S-3 (13), S-3/A (13), ARS (12), 5 (11), 8-K/A (10), SC 13D (10), 424B5 (9), 3/A (7), EFFECT (6), 425 (5), S-1/A (5), 424B7 (4), DEFA14A (4), S-4 (4), 424B2 (3), 8-A12B (3), 8-A12B/A (3), REGDEX (3), S-3ASR (3), SD (3), 25 (2), 424B1 (2), DEL AM (2), POS AM (2), PRER14A (2), S-1 (2), SCHEDULE 13G/A (2), 10-K405 (1), 10QSB (1), 15-12G (1), 5/A (1), CERT (1), D (1), DEFS14A (1), FWP (1), PRES14A (1), PX14A6G (1), S-4/A (1), S-8 POS (1), SCHEDULE 13G (1)

  • Latest filingsAnnual report (10-K) Feb 26, 2026
    Quarterly report (10-Q) Aug 6, 2026
    Proxy statement (DEF 14A) Apr 7, 2026
    Latest 8-K (8-K) Aug 6, 2026

Securities registered for trading

ClassSymbolExchange
Common Stock, $ 0.003 par valueLNGNew York Stock Exchange

From the cover page of the 10-K filed Feb 26, 2026 (Section 12(b) of the Exchange Act).113

Risk factors and legal proceedings

The risks Cheniere Energy names in Item 1A of its 10-K filed Feb 26, 2026: 26 risks under these headings, as written.113

  • Risks Relating to Our Financial Matters
  • An inability to source capital to supplement our available cash resources and existing credit facilities could cause us to have inadequate liquidity and could materially and adversely affect us.
  • Our ability to generate cash is substantially dependent upon the performance by customers under long-term contracts that we have entered into, and we could be materially and adversely affected if any significant portion of our customers fails to perform its contractual obligations for any reason.
  • We and our subsidiaries may be restricted under the terms of our and their indebtedness from paying dividends or distributions under certain circumstances, which could materially and adversely affect our liquidity.
  • Restrictions in agreements governing us and our subsidiaries’ indebtedness may prevent us and our subsidiaries from engaging in certain beneficial transactions, which could materially and adversely affect us.
  • Our use of derivative instruments, including our IPM agreements, to manage risks could have a significant adverse or otherwise volatile effect on our earnings reported under GAAP and our liquidity.
  • Our ability to declare and pay dividends and repurchase shares is subject to certain considerations.
  • Risks Relating to Our Operations and Industry
  • Catastrophic weather events or other disasters could result in an interruption of our operations, a delay in the construction of our Liquefaction Projects, damage to our Liquefaction Projects and increased insurance costs, all of which could adversely affect us.
  • Disruptions to the third party supply of natural gas to our pipelines and facilities could have a material adverse effect on our business, contracts, financial condition, operating results, cash flow, liquidity and prospects.
  • We may not be able to purchase or receive physical delivery of sufficient natural gas to satisfy our delivery obligations under the SPAs, which could have a material adverse effect on us.
  • We are subject to significant construction and operating hazards and uninsured risks, one or more of which may create significant liabilities and losses for us.
The other 16 risks
  • We are dependent on our EPC partners and other contractors for the successful completion of the Corpus Christi Stage 3 Project, the CCL Midscale Trains 8 & 9 Project and any potential expansion projects, including the SPL Expansion Project and the CCL Expansion Project.
  • Cost overruns and delays in the construction of our expansion projects, including the Corpus Christi Stage 3 Project, the CCL Midscale Trains 8 & 9 Project, the SPL Expansion Project and the CCL Expansion Project, as well as difficulties in obtaining sufficient financing to pay for such costs and delays, could have a material adverse effect on our business, contracts, financial condition, operating results, cash flow, liquidity and prospects.
  • Our ability to complete development and/or construction of additional Trains, including the SPL Expansion Project and the CCL Expansion Project, will be contingent on our ability to obtain additional funding. If we are unable to obtain sufficient funding, we may be unable to fully execute our growth strategy.
  • There may be impediments to the transport of LNG to customers, such as shortages of LNG vessels worldwide or operational impacts on LNG shipping, which could have a material adverse effect on our business, contracts, financial condition, operating results, cash flow, liquidity and prospects.
  • Changes to U.S. trade policy could have a material adverse effect on our business, contracts, financial condition, operating results, cash flow, liquidity and prospects.
  • Cyclical or other changes in the demand for and price of LNG and natural gas may adversely affect our LNG business and the performance of our customers and could have a material adverse effect on our business, contracts, financial condition, operating results, cash flow, liquidity and prospects.
  • Failure of exported LNG to be a long term competitive source of energy for international markets could adversely affect our customers and could materially and adversely affect our business, contracts, financial condition, operating results, cash flow, liquidity and prospects.
  • We face competition based upon the international market price for LNG.
  • A cyberattack involving our business, operational control systems or related infrastructure, or that of third parties with whom we do business, including pipelines which supply our Liquefaction Projects, or an attack on our critical suppliers, could negatively impact our business or operations, result in data security breaches, impede the processing of transactions, delay financial or compliance reporting and potentially harm our reputation.
  • We may experience increased labor costs, and the unavailability of skilled workers or our failure to attract and retain qualified personnel could adversely affect us. In addition, changes in our senior management or other key personnel could affect our business results.
  • Outbreaks of infectious diseases, such as COVID-19, at one or more of our facilities could adversely affect our operations or business.
  • Risks Relating to Regulations
  • Failure to obtain and maintain approvals and permits from governmental and regulatory agencies with respect to the design, construction and operation of our facilities, the development and operation of our pipelines and the export of LNG could impede operations and construction and could have a material adverse effect on our business, contracts, financial condition, operating results, cash flow, liquidity and prospects.
  • Our interstate natural gas pipelines and their FERC gas tariffs are subject to FERC regulation. If we fail to comply with such regulation, we could be subject to substantial penalties and fines.
  • Existing and future safety, environmental and similar laws and governmental regulations could result in increased compliance costs or additional operating costs or construction costs and restrictions.
  • Pipeline safety and compliance programs and repairs may impose significant costs and liabilities on us.
  • Additions or changes in tax laws and regulations or variables impacting our tax obligations could potentially affect our financial results or liquidity.

Legal proceedings

We are, and may in the future be, involved as a party to various legal proceedings, which are incidental to the ordinary course of business. We regularly analyze current information and, as necessary, provide accruals for probable liabilities on the eventual disposition of these matters.

LDEQ Matter

We are in discussions with the LDEQ to resolve alleged non-compliance with national emission standards for formaldehyde from combustion turbines at the Sabine Pass LNG Terminal. The allegations are identified in a Consolidated Compliance Order and Notice of Potential Penalty, Tracking No. AE-CN-22-00833 (the “2023 Compliance Order”) issued by the LDEQ on April 12, 2023. In August 2004, the EPA stayed the application of the emission standard to combustion turbines such as those at the Sabine Pass LNG Terminal. In March 2022, the EPA lifted the stay, and in June 2022, we petitioned the EPA and LDEQ for approval of additional operating parameters to demonstrate compliance with the emission limitation. The EPA approved the petition on July 31, 2025 and in October 2025 the LDEQ confirmed that all remaining milestones under the 2023 Compliance Order have been met. We continue to work with the LDEQ to resolve the 2023 Compliance Order. As of December 2025, we had filed test results with the LDEQ indicating that for the 2025 testing period all 44 turbines met the relevant compliance standard. We do not expect that any ultimate penalty will have a material adverse impact on our financial results.

The opening of Item 3, Legal Proceedings.113

Sources

The numbers on this page point here. Each one links to the record it came from.

  1. 1
  2. 2
  3. 3
  4. 4
  5. 5
    Yahoo FinanceLNG quote
  6. 6
    Company websiteCheniere Energy logo
  7. 7
  8. 8
  9. 9
  10. 10
  11. 11
  12. 12
  13. 13
  14. 14
  15. 15
  16. 16
  17. 17
  18. 18
  19. 19
  20. 20
  21. 21
  22. 22
  23. 23
  24. 24
  25. 25
  26. 26
  27. 27
  28. 28
  29. 29
  30. 30
  31. 31
  32. 32
  33. 33
  34. 34
  35. 35
  36. 36
  37. 37
  38. 38
  39. 39
  40. 40
  41. 41
  42. 42
  43. 43
  44. 44
  45. 45
  46. 46
  47. 47
  48. 48
  49. 49
  50. 50
  51. 51
  52. 52
  53. 53
  54. 54
  55. 55
  56. 56
  57. 57
  58. 58
  59. 59
  60. 60
  61. 61
  62. 62
  63. 63
  64. 64
  65. 65
  66. 66
  67. 67
  68. 68
  69. 69
  70. 70
  71. 71
  72. 72
  73. 73
  74. 74
  75. 75
  76. 76
  77. 77
  78. 78
  79. 79
  80. 80
  81. 81
  82. 82
  83. 83
  84. 84
  85. 85
  86. 86
  87. 87
  88. 88
  89. 89
  90. 90
  91. 91
  92. 92
  93. 93
  94. 94
  95. 95
  96. 96
  97. 97
  98. 98
  99. 99
  100. 100
  101. 101
  102. 102
  103. 103
  104. 104
  105. 105
  106. 106
  107. 107
  108. 108
  109. 109
  110. 110
  111. 111
  112. 112
  113. 113