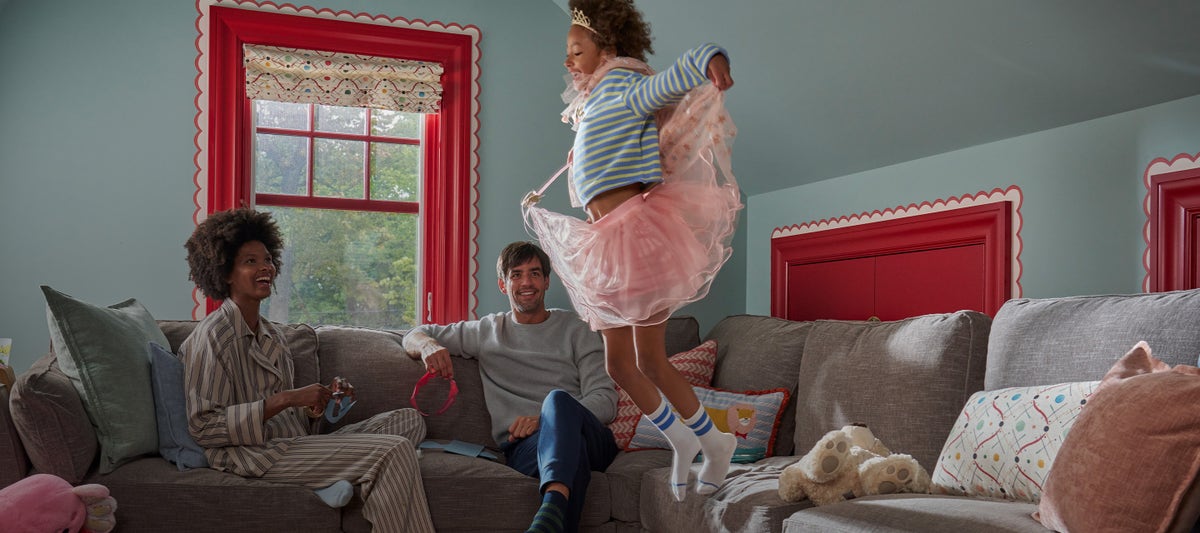
The Lovesac Company is an American furniture retailer, specializing in a patented modular furniture system called Sactionals. Sactionals consist of two combinable pieces, “Seats” and “Sides,” as well as custom-fit covers and associated accessories. Lovesac also sells Sacs, a bag seat filled with a proprietary foam mixture.3 It was founded by Shawn David Nelson.1Wikipedia text CC BY-SA 4.0
The Lovesac Company is an American furniture retailer, specializing in a patented modular furniture system called Sactionals. Sactionals consist of two combinable pieces, “Seats” and “Sides,” as well as custom-fit covers and associated accessories. Lovesac also sells Sacs, a bag seat filled with a proprietary foam mixture.3
Financials
From the company’s reports to the SEC. Every number links to the filing it came from.
Revenue891011124$697.1M in 2026+320% since 2019Gross profit891011124$393.2M in 2026+333% since 2019Operating income891011124$5.4M in 2026Net income891011124$4.1M in 2026
Revenue1314$161.2M in Q2 FY2026+17% since Q1 FY2026Gross profit1314$110.3M in Q2 FY2026+53% since Q1 FY2026Operating income1314$10.9M in Q2 FY2026Net income1314$7.4M in Q2 FY2026
Every line of the income statement as filed: the last 3 fiscal years, latest first.4
Period ending
2026-01-31
2025-01-31
2024-01-31
Net sales
$697.1M
$680.6M
$700.3M
Cost of merchandise sold
$303.9M
$282.8M
$299.2M
Gross profit
$393.2M
$397.8M
$401.0M
Selling, general and administrative expenses
$284.0M
$281.4M
$264.3M
Advertising and marketing
$88.7M
$88.0M
$94.0M
Depreciation and amortization
$15.2M
$14.7M
$12.6M
Total operating expenses
$387.9M
$384.2M
$371.0M
Operating income
$5.4M
$13.6M
$30.1M
Interest and other income, net
$1.3M
$2.8M
$1.7M
Net income before taxes
$6.7M
$16.4M
$31.8M
Income tax expense
$2.6M
$4.9M
$8.0M
Net income
$4.1M
$11.6M
$23.9M
Basic (in dollars per share)
$0.28
$0.75
$1.55
Diluted (in dollars per share)
$0.28
$0.69
$1.45
Basic (in shares)
14.7M shares
15.5M shares
15.4M shares
Diluted (in shares)
14.7M shares
16.8M shares
16.5M shares
No quarter-by-quarter statement was filed.
Total assets81591011124$534.7M in 2026+409% since 2019Total liabilities81591011124$316.0M in 2026+1104% since 2019Shareholders’ equity81511104$218.7M in 2026+178% since 2019Cash1591011124$101.9M in 2026+108% since 2019
Total assets1314$539.0M in Q2 FY2026+1% since Q1 FY2026Total liabilities1314$329.0M in Q2 FY2026+4% since Q1 FY2026Shareholders’ equity1314$210.0M in Q2 FY2026−4% since Q1 FY2026Cash1314$68.8M in Q2 FY2026−32% since Q1 FY2026
Every line of the balance sheet as filed: the last 4 fiscal years (annual) or 4 quarters (quarterly), latest first.4
Period ending
2026-01-31
2025-01-31
2024-01-31
2023-01-31
Cash and cash equivalents
$101.9M
$83.7M
Trade accounts receivable, net
$11.7M
$16.8M
Merchandise inventories, net
$106.3M
$124.3M
Prepaid expenses
$10.5M
$14.8M
Other current assets
$6.3M
$6.9M
Total Current Assets
$236.6M
$246.6M
Property and equipment, net
$86.4M
$78.0M
Operating lease right-of-use assets
$163.3M
$157.8M
Goodwill
$144.0K
$144.0K
Intangible assets, net
$2.4M
$1.6M
Deferred tax asset
$13.4M
$15.3M
Other assets
$32.4M
$32.9M
Total Assets
$534.7M
$532.2M
Accounts payable
$43.7M
$51.8M
Accrued expenses
$38.8M
$52.0M
Payroll payable
$21.9M
$9.5M
Customer deposits
$11.5M
$11.2M
Current operating lease liabilities
$24.1M
$22.7M
Sales taxes payable
$7.0M
$7.9M
Total Current Liabilities
$147.1M
$155.1M
Operating lease liabilities, long-term
$168.4M
$160.4M
Income tax payable, long-term
$464.0K
$424.0K
Line of credit
$0
$0
Total Liabilities
$316.0M
$315.9M
Preferred stock $0.00001 par value, 10,000,000 shares authorized, no shares issued or outstanding as of February 1, 2026 and February 2, 2025.
$0
$0
Common stock $0.00001 par value, 40,000,000 shares authorized, 14,617,238 shares issued and outstanding as of February 1, 2026 and 14,786,934 shares issued and outstanding as of February 2, 2025.
$0
$0
Additional paid-in capital
$194.8M
$190.5M
Accumulated earnings
$23.9M
$25.8M
Stockholders Equity
$218.7M
$216.4M
$217.5M
$193.1M
Total Liabilities and Stockholders Equity
$534.7M
$532.2M
Preferred stock, par value (in dollars per share)
$0.00
$0.00
Preferred stock, shares authorized (in shares)
10.0M shares
10.0M shares
Preferred stock, shares issued (in shares)
0 shares
0 shares
Preferred stock, shares outstanding (in shares)
0 shares
0 shares
Common stock, par value (in dollars per share)
$0.00
$0.00
Common stock, shares authorized (in shares)
40.0M shares
40.0M shares
Common stock, shares issued (in shares)
14.6M shares
14.8M shares
Common stock, shares outstanding (in shares)
14.6M shares
14.8M shares
Cash from operations891011124$49.3M in 2026Capital spending891011124$23.1M in 2026+115% since 2019Free cash flow891011124$26.2M in 2026Share buybacks124$6.0M in 2026
Cash flow is reported year to date, not quarter by quarter, so there are no separate quarterly figures.
Every line of the cash flow as filed: the last 3 fiscal years, latest first.4
Period ending
2026-01-31
2025-01-31
2024-01-31
Net income
$4.1M
$11.6M
$23.9M
Depreciation and amortization of property and equipment
$14.9M
$14.3M
$12.2M
Amortization of other intangible assets
$319.0K
$418.0K
$429.0K
Amortization of deferred financing fees
$73.0K
$127.0K
$159.0K
Net loss on disposal of property and equipment
$466.0K
$140.0K
$235.0K
Gain on lease termination
-$167.0K
$0
-$131.0K
Impairment of long-lived assets
$1.5M
$0
$0
Equity based compensation
$5.5M
$7.9M
$4.2M
Non-cash lease expense
$27.1M
$25.2M
$22.6M
Deferred income taxes
$1.9M
-$4.5M
-$2.1M
Trade accounts receivable
$5.0M
-$3.3M
-$4.4M
Merchandise inventories
$18.0M
-$25.9M
$21.2M
Prepaid expenses and other current assets
$5.0M
-$6.1M
-$164.0K
Other assets
$486.0K
-$4.2M
-$6.3M
Accounts payable
-$8.9M
$22.4M
$2.7M
Accrued expenses and other payables
-$1.5M
$17.5M
$14.0M
Operating lease liabilities
-$24.9M
-$19.5M
-$14.0M
Customer deposits
$294.0K
$3.0M
$1.5M
Other liabilities
$40.0K
-$28.0K
$452.0K
Net cash provided by operating activities
$49.3M
$39.0M
$76.4M
Purchase of property and equipment
-$23.1M
-$21.0M
-$28.7M
Payments for patents and trademarks
-$885.0K
-$491.0K
-$475.0K
Net cash used in investing activities
-$24.0M
-$21.5M
-$29.2M
Taxes paid for net share settlement of equity awards
-$1.2M
-$530.0K
-$3.7M
Repurchases of common stock
-$6.0M
-$19.9M
$0
Proceeds from the line of credit
$0
$0
$255.0K
Payments on the line of credit
$0
$0
-$255.0K
Payment of deferred financing costs
-$12.0K
-$303.0K
-$52.0K
Net cash used in financing activities
-$7.2M
-$20.8M
-$3.7M
Net change in cash and cash equivalents
$18.1M
-$3.3M
$43.5M
Cash paid for taxes
$10.0M
$8.4M
$1.8M
Cash paid for interest
$122.0K
$112.0K
$146.0K
Asset acquisitions not yet paid for at period end
$1.8M
$1.2M
$1.6M
Leasehold improvements acquired through lease incentive
LoveSac sits at the top of its group. 1 entity, 1 country on record. Switch between the flow chart and the network, and select any entity to see its details.
Major holders of LoveSac
Philotimo Fund, LPFiled SCHEDULE 13G/A on LoveSac, latest May 14, 2026 (2 filings since Mar 30, 2026)
Senvest Management, LLCFiled SCHEDULE 13G/A on LoveSac, latest May 14, 2026 (5 filings since Aug 14, 2024)
VANGUARD GROUP INCFiled SCHEDULE 13G/A on LoveSac, latest Mar 27, 2026 (2 filings since Feb 13, 2024)
WASATCH ADVISORS LPFiled SC 13G/A on LoveSac, latest Feb 9, 2024 (3 filings since Feb 10, 2022)
LoveSacStamford
Built from major holders from Schedules 13D and 13G. Each entity in the chart links to its source.
What it owns
What LoveSac reports owning in its annual reports to the SEC: buildings, land and equipment, real estate and locations, investments, intangible assets and inventory, at the end of its latest fiscal year and a year before.
Our primary offices are located in Stamford, Connecticut, where we occupy 28,000 square feet of office space pursuant to a lease agreement that expires in March 2040, and in Saint George, Utah, where we occupy 10,696 square feet of office space pursuant to a lease agreement that expires September 2031. We also lease retail space for our showrooms, in 278 locations throughout the majority of the U.S. states including Alabama, Arkansas, Arizona, California, Colorado, Connecticut, Delaware, Florida, Georgia, Idaho, Illinois, Indiana, Iowa, Kansas, Kentucky, Louisiana, Maine, Maryland, Massachusetts, Michigan, Minnesota, Missouri, Montana, Nebraska, Nevada, New Hampshire, New Jersey, New Mexico, New York, North Carolina, North Dakota, Ohio, Oklahoma, Oregon, Pennsylvania, Rhode Island, South Dakota, South Carolina, Tennessee, Texas, Utah, Virginia, Washington, Wisconsin and the District of Columbia.
Lovesac was created in 1995 by Shawn D. Nelson, who formerly hand-made the chairs and delivered them to other students at the University of Utah. In 2005, Nelson won Fox's Rebel Billionaire reality show. The company relocated from Salt Lake City to Stamford, Connecticut in 2006, as it raised private-equity capital in the area. Lovesac joined the Nasdaq stock exchange on Wednesday, June 27, 2018, trading under the symbol LOVE.
In January 2006, the company filed for Chapter 11 bankruptcy protection. They left Chapter 11 protection in August 2006.
In 2012, Lovesac was named the fastest growing furniture company in the U.S. by Furniture Today magazine as well as recognized for being one of the top 100 furniture companies.
According to founder Shawn David Nelson, Lovesac planned to move 75% of its production out of China by 2020, due to trade war tariffs. As of late 2019, 40% of Lovesac's manufacturing was done in Vietnam and Malaysia, which were free of the tariff levels.
Dec 10, 2026Reports results for the quarter ending Oct/2026 A year earlier it reported ($0.72) a share, on Dec 11, 2025.49
When it reported results
Sep 10, 2026Reported quarterly or annual results37
Jun 11, 2026Reported quarterly or annual results39
Mar 26, 2026Reported quarterly or annual results41
Dec 11, 2025Reported quarterly or annual results43
Sep 11, 2025Reported quarterly or annual results45
Jun 12, 2025Reported quarterly or annual results48
Apr 10, 2025Reported quarterly or annual results50
Dec 12, 2024Reported quarterly or annual results51
Upcoming dates from Nasdaq's calendar; past results from the company's 8-K filings (Item 2.02). The full markets calendar
Filings
341 filings to the SEC since October 2021: 7 annual reports, 17 quarterly reports, 45 major events, 191 insider forms, 49 large holders, 32 other. The latest 20:
70 open-market trades by officers, directors and large owners since October 2021: 26 buys and 44 sales. Grants, option exercises and gifts are left out.
What the company paid its top executives, from the summary compensation table in its proxy statement. Total pay includes salary, bonus, stock and option awards and other pay, as the company valued them.
The largest holders among investment managers' 13F reports for the quarter ending Jun 30, 2026, the top 25 of 100. Change is in shares since the quarter before.
From the cover page of the 10-K filed Apr 2, 2026 (Section 12(b) of the Exchange Act).16
Risk factors and legal proceedings
The risks LoveSac names in Item 1A of its 10-K filed Apr 2, 2026: 54 risks under these headings, as written.16
Business and Industry Risks
If we fail to manage our growth effectively, our business, financial condition and operating results could be harmed.
Our business, results of operations and financial condition may be adversely affected by global economic conditions and the effect of economic pressures and other business factors on discretionary consumer spending and consumer preferences.
Our inability to maintain our brand image, engage new and existing customers and gain market share could have a material adverse effect on our growth strategy and our business, financial condition, operating results and prospects.
If we fail to acquire new customers, or fail to do so in a cost-effective manner, we may not be able to achieve revenue growth or profitability.
Our business is highly competitive. Competition presents an ongoing threat to the success of our business.
We rely on the performance of members of management and highly skilled personnel. If we are unable to attract, develop, motivate and retain well-qualified associates, our business could be harmed.
System interruptions that impair customer access to our sites or other performance failures in our technology infrastructure could damage our business, reputation and brand, and substantially harm our business and results of operations.
Unauthorized disclosure of sensitive or confidential information, whether through a breach of our computer system or otherwise, could severely hurt our business.
A substantial portion of our business is dependent on a small number of suppliers. In some instances, our suppliers are the only source of supply, or one of a limited number of suppliers, used by the Company for materials, components or services. A material disruption or labor shortage at any of our suppliers could impede our ability to meet customer demand, manufacture or deliver our products, and reduce our sales, and/or negatively affect our financial results.
We are subject to risks associated with our dependence on foreign manufacturing, suppliers and imports for our products.
Our reliance on suppliers in developing countries increases our risk with respect to available manufacturing infrastructure, labor and employee relations, political and economic stability, corruption, and regulatory, environmental, health and safety compliance.
The other 43 risks
We may not be able to achieve expected returns from additional investments in U.S. domestic manufacturing capabilities.
Most of our products are shipped from our suppliers by ocean vessel. If a disruption occurs in the operation of ports through which our products are imported, we may incur increased costs and suffer delays, which could have a material adverse effect on our business, financial condition, operating results and prospects.
Increases in the demand for, or the price of, raw materials used to manufacture our products or other fluctuations in sourcing or distribution costs could increase our costs and negatively impact our gross margin.
Our inability to manage our inventory levels and products, including with respect to our omni-channel operations, could have a material adverse effect on our business, financial condition, operating results and prospects.
We are required to make substantial lease payments under our leases, and any failure to make these lease payments when due would likely harm our business. In addition, many of our leases contain use restrictions that may limit our ability to introduce new products or relocation clauses that allow the landlord to move the location of our showrooms. As our leases expire, we may be unable to negotiate acceptable renewals.
Our business depends on effective marketing and increased customer traffic, and the failure to effectively develop and expand our sales and marketing capabilities could harm our ability to increase our customer base and achieve broader market acceptance of our e-commerce and our omnichannel approach for shopping.
Our increased use of social media poses reputational risks.
Our efforts to launch new products may not be successful.
Our ability to attract customers to our showrooms depends heavily on successfully locating our showrooms in suitable locations. Any impairment of a showroom location, including any decrease in customer traffic, could cause our sales to be lower than expected.
We may be unable to successfully open and operate new showrooms, which could have a material adverse effect on our business, financial condition, operating results and prospects.
As we expand our showroom base and expend capital remodeling our existing showrooms, we may not be able to achieve the showroom sales growth rates that we have achieved in the past and there is no guarantee that this will result in incremental showroom traffic or sales, which could cause our share price to decline.
Our inability to successfully optimize our omni-channel operations and maintain a relevant and reliable omni-channel experience for our customers could have a material adverse effect on our growth strategy and our business, financial condition, operating results and prospects.
Purchasers of furniture may choose not to shop online, which could affect the growth of our business.
We depend on our ecommerce business and failure to successfully manage this business and deliver a seamless omni-channel shopping experience to our customers could have an adverse effect on our growth strategy, business, financial condition, operating results and prospects.
Seasonal trends in our business create variability in our financial and operating results and place increased strain on our operations.
Climate change or measures to address climate change can negatively affect our business or damage our reputation.
Significant merchandise returns could harm our business.
We are subject to risks related to online payment methods.
Financial Risks
Our ability to raise capital in the future may be limited. Our inability to raise capital when needed could prevent us from growing and could have a material adverse effect on our business, financial condition, operating results and prospects.
We face risks related to the restatement of our previously issued financial statements and the material weaknesses in our internal control over financial reporting.
We may be unable to accurately forecast our operating results and growth rate, which may adversely affect our reported results and stock price.
We may not be able to fully utilize our media credits if our third-party vendor ceases operations or if there are significant changes to our marketing strategy before the credits expire.
Legal, Tax and Regulatory Risks
A significant disruption in, or breach in security of, our information technology systems or violations of data protection laws could have a material adverse effect on our business and reputation.
Failure to comply with personal data protection and privacy laws, and other laws and regulations applicable to our business, can adversely affect our business.
We may not be able to adequately protect our intellectual property rights.
Evolving government regulations and investor expectations on environmental, social and governance factors may impose additional costs and expose us to new risks.
We may be subject to product liability claims if people or property are harmed by the products we sell.
Product warranty claims could have a material adverse effect on our business.
Product recalls and other claims could affect our financial position and results of operations.
We are and may in the future be subject to securities litigation, which is expensive and could divert management attention.
Our insurance coverage may be insufficient to cover litigation or other claims asserted against us, which could have a material adverse effect on our business, financial condition and results of operation.
Government regulation of the Internet and ecommerce is evolving, and unfavorable changes or failure by us to comply with these regulations could substantially harm our business and results of operations.
Our products or marketing activities may be found to infringe or violate the intellectual property rights of others.
Risks Related to Ownership of Our Common Stock
The trading price of the shares of our common stock has been and is likely to continue to be highly volatile.
If securities or industry analysts do not publish research or publish inaccurate or unfavorable research about our business, our stock price and trading volume could decline.
Future sales and issuances of our common stock or rights to purchase common stock could result in additional dilution of the percentage ownership of our stockholders and could cause our stock price to decline.
We cannot guarantee that our share repurchase program will be fully consummated or will enhance long-term stockholder value, and share repurchases could increase the volatility of the trading price of our common stock and diminish our cash reserves.
Anti-takeover provisions in our charter documents and under Delaware law could make an acquisition of our Company more difficult, and limit attempts by our stockholders to replace or remove our current management.
Actions of activist stockholders could be costly and time-consuming, divert management’s attention and resources, and have an adverse effect on our business.
Claims for indemnification by our directors and officers may reduce our available funds to satisfy successful third-party claims against us and may reduce the amount of money available to us.
Our amended and restated bylaws designates the Court of Chancery of the State of Delaware as the sole and exclusive forum for certain types of actions and proceedings that may be initiated by our stockholders, and designates the federal district courts of the United States as the sole and exclusive forum for claims arising under the Securities Act, which, in each case could limit our stockholders’ ability to obtain a favorable judicial forum for disputes with us or our directors, officers employees, agents or other stockholders.
We do not expect to declare any dividends in the foreseeable future.
We may fail to meet our publicly announced guidance or other expectations about our business and future operating results, which would cause the price of our securities to decline.
Legal proceedings
See Note 7. Commitments, Contingencies and Related Parties to our financial statements within Part IV of this Annual Report on Form 10-K for a description of our legal proceedings, which is incorporated herein by reference.