
RCKY on Nasdaq

Rocky Brands

Logo: rockybrands.com5

Apparel company

Rocky Brands, Inc., formerly known as Rocky Shoes & Boots, Inc., is a company which designs, develops, manufactures, and markets outdoor, work, western and military footwear, and other outdoor and work apparel and accessories. The company was founded in 1932 in Nelsonville, Ohio, and still maintains its corporate headquarters there.3 Its shares trade on Nasdaq under the symbol RCKY.1 Wikipedia text CC BY-SA 4.0

Price unavailable

Last updated Oct 21, 2026.

Overview

1932Founded1

Compare with Wolverine World Wide, STEVEN MADDEN, LTD. or Caleres, or pick any stock.

  • TickerRCKY on Nasdaq1
  • IndustryFootwear, (No Rubber)1
  • HeadquartersNelsonville1
  • Websitewww.rockybrands.com
  • Incorporated inOH6
  • Business address39 East Canal Street, Nelsonville, Oh 457646
  • Filer categoryAccelerated filer, Smaller reporting company6
  • Legal formCorporation4
  • LEI5299004HQ6GCTW838N964
  • StatusActive4
  • LEI statusLapsed (not renewed)4
  • Registered addressc/o ACME AGENT, INC., 41 SOUTH HIGH STREET SUITE 2800, 43215 Columbus, United States4
  • Registered withCorporation Database (Ohio Secretary of State), 8216744
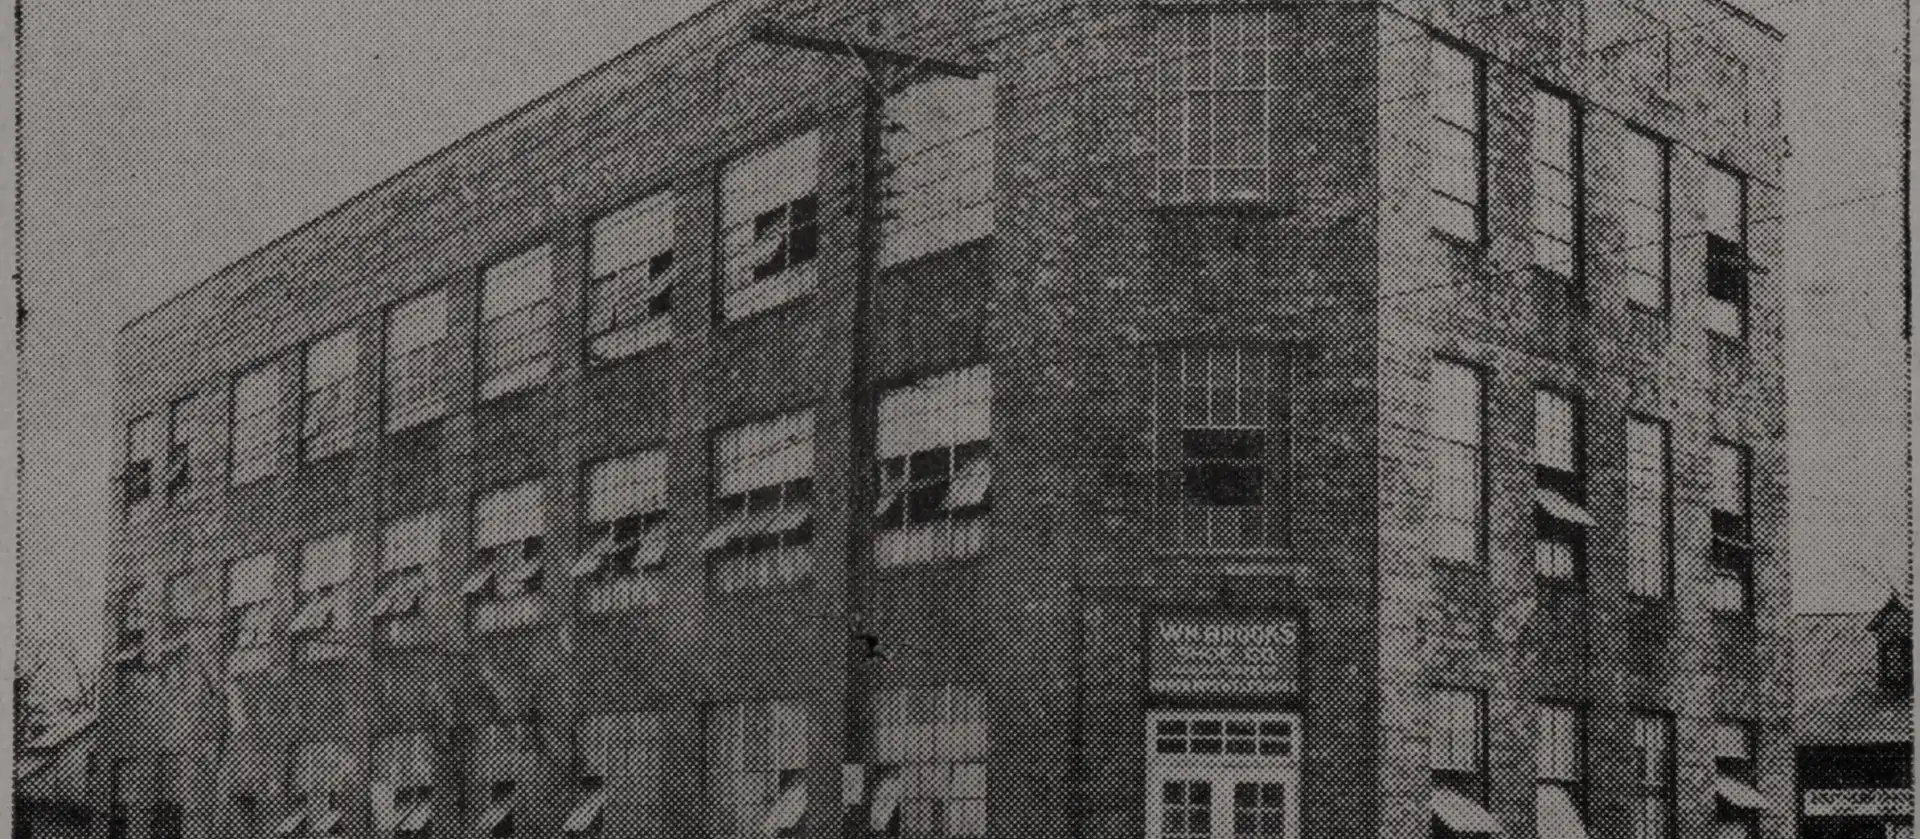
Rocky Brands image from its website
Image: rockybrands.com5

Rocky Brands, Inc., formerly known as Rocky Shoes & Boots, Inc., is a company which designs, develops, manufactures, and markets outdoor, work, western and military footwear, and other outdoor and work apparel and accessories. The company was founded in 1932 in Nelsonville, Ohio, and still maintains its corporate headquarters there.3

Financials

From the company’s reports to the SEC. Every number links to the filing it came from.

Key numbers, fiscal 2025

40.9%Gross margin9
7.7%Operating margin9
4.6%Net margin9
6.2%Revenue growth, 20259
8.8%Return on equity9
0.45×Debt to equity9
$9.7MFree cash flow9

What sells

Revenue by product, business segment and region, as the company reports it to the SEC.

Products and services

Work Footwear brought in 40% of the revenue Rocky Brands broke down this way in fiscal 2025.

  1. Work Footwear$193.6M940%up 2% from 2024
  2. Outdoor Footwear$165.7M934%up 27% from 2024
  3. Western Footwear$76.4M916%down 8% from 2024
  4. Duty and Commercial Military Footwear$30.7M96%down 11% from 2024
  5. Military Footwear$10.0M92%down 11% from 2024
  6. Product and Service, Other$5.5M91%up 16% from 2024
Products and services by year
Products and services20242025
Work Footwear$190.3M$193.6M
Outdoor Footwear$130.2M$165.7M
Western Footwear$82.6M$76.4M
Duty and Commercial Military Footwear$34.5M$30.7M
Military Footwear$11.3M$10.0M
Product and Service, Other$4.7M$5.5M

Business segments

Wholesale brought in 66% of the revenue Rocky Brands broke down this way in fiscal 2025.

  1. Wholesale$316.6M966%up 1% from 2024
  2. Retail$152.9M932%up 21% from 2024
  3. Contract Manufacturing$12.5M93%down 8% from 2024
Business segments by year
Business segments20242025
Wholesale$313.3M$316.6M
Retail$126.9M$152.9M
Contract Manufacturing$13.6M$12.5M

Where the money goes

Where each dollar of revenue went, fiscal 2025

  • Cost of revenue59¢$284.7M
  • Other costs35¢$170.1M
  • Income tax1¢$4.9M
  • Profit5¢$22.3M

Out of $482.0M in revenue.9

Where each dollar of operating cash went, fiscal 2025

  • Capital spending40¢$6.6M
  • Dividends paid28¢$4.6M
  • Share buybacks1¢$201.0K
  • Kept or used elsewhere30¢$4.9M

Out of $16.3M of cash from operations.9

Financial statements

Revenue101112139$482.0M in 2025+78% since 2019
0$200.0M$400.0M$600.0M$800.0M2019: $270.4M$270.4M20192020: $277.3M$277.3M2020+3%2021: $514.2M$514.2M2021+85%2022: $615.5M$615.5M2022+20%2023: $461.8M$461.8M2023−25%2024: $453.8M$453.8M2024−2%2025: $482.0M$482.0M2025+6%
Gross profit141112139$197.3M in 2025+102% since 2019
0$100.0M$200.0M$300.0M2019: $97.7M$97.7M20192020: $104.7M$104.7M2020+7%2021: $194.5M$194.5M2021+86%2022: $225.2M$225.2M2022+16%2023: $178.6M$178.6M2023−21%2024: $179.0M$179.0M2024+0%2025: $197.3M$197.3M2025+10%
Operating income141112139$37.2M in 2025+68% since 2019
0$20.0M$40.0M$60.0M2019: $22.1M$22.1M20192020: $27.2M$27.2M2020+23%2021: $36.0M$36.0M2021+32%2022: $44.0M$44.0M2022+22%2023: $35.4M$35.4M2023−20%2024: $31.1M$31.1M2024−12%2025: $37.2M$37.2M2025+20%
Net income141112139$22.3M in 2025+28% since 2019
0$10.0M$20.0M$30.0M2019: $17.5M$17.5M20192020: $21.0M$21.0M2020+20%2021: $20.6M$20.6M2021−2%2022: $20.5M$20.5M2022−0%2023: $10.4M$10.4M2023−49%2024: $11.4M$11.4M2024+9%2025: $22.3M$22.3M2025+96%

Every line of the income statement as filed: the last 2 fiscal years, latest first.9

Period ending2025-12-312024-12-31
NET SALES$482.0M$453.8M
COST OF GOODS SOLD$284.7M$274.8M
GROSS MARGIN$197.3M$179.0M
OPERATING EXPENSES$160.1M$147.9M
INCOME FROM OPERATIONS$37.2M$31.1M
INTEREST EXPENSE AND OTHER net-$10.0M-$17.0M
INCOME BEFORE INCOME TAX EXPENSE$27.2M$14.1M
INCOME TAX EXPENSE$4.9M$2.7M
NET INCOME$22.3M$11.4M
Basic (in dollars per share)$2.98$1.53
Diluted (in dollars per share)$2.96$1.52
Basic (in shares)7.5M shares7.4M shares
Diluted (in shares)7.5M shares7.5M shares

Compare Rocky Brands with another company

Corporate structure

Rocky Brands sits at the top of its group. 1 entity, 1 country on record. Switch between the flow chart and the network, and select any entity to see its details.

Major holders of Rocky Brands

  • Rocky Brands Nelsonville, Ohio, United States

Built from parent and subsidiary links from GLEIF, the Global Legal Entity Identifier Foundation (CC0); subsidiaries listed in Exhibit 21 of annual reports filed with the SEC; major holders from Schedules 13D and 13G. Each entity in the chart links to its source.

What it owns

What Rocky Brands reports owning in its annual reports to the SEC: buildings, land and equipment, real estate and locations, investments, intangible assets and inventory, at the end of its latest fiscal year and a year before.

Property and equipment

ItemLatestA year beforeChange
Land$2.2M9 Dec 31, 2025$972.0K9 Dec 31, 2024+123.9%
Buildings and improvements$37.9M9 Dec 31, 2025$37.7M9 Dec 31, 2024+0.5%
Machinery and equipment$64.4M9 Dec 31, 2025$62.0M9 Dec 31, 2024+4.0%
Furniture and fixtures$1.5M9 Dec 31, 2025$1.5M9 Dec 31, 2024−0.1%
Construction in progress$12.0M9 Dec 31, 2025$11.0M9 Dec 31, 2024+9.5%
Property and equipment, before depreciation$35.7M9 Dec 31, 2025$37.7M9 Dec 31, 2024−5.2%
Accumulated depreciation$81.5M9 Dec 31, 2025$75.2M9 Dec 31, 2024+8.3%
Property and equipment, net$49.9M9 Dec 31, 2025$49.7M9 Dec 31, 2024+0.5%
Operating-lease assets (leased space)$4.2M9 Dec 31, 2025$6.0M9 Dec 31, 2024−30.8%

Real estate and locations

ItemLatestA year beforeChange
Stores10,00013 Dec 31, 202410,00012 Dec 31, 20230%

Investments

ItemLatestA year beforeChange
Cash and cash equivalents$2.9M9 Dec 31, 2025$3.7M9 Dec 31, 2024−22.0%

Intangibles and goodwill

ItemLatestA year beforeChange
Goodwill$47.8M9 Dec 31, 2025$47.8M9 Dec 31, 20240%
Intangible assets, net (excluding goodwill)$103.0M9 Dec 31, 2025$105.8M9 Dec 31, 2024−2.6%
Accumulated amortization$14.2M9 Dec 31, 2025$11.4M9 Dec 31, 2024+24.5%
Finite-lived intangibles, net$28.4M9 Dec 31, 2025$31.2M13 Dec 31, 2024−9.0%

Inventory

ItemLatestA year beforeChange
Inventory, total$181.1M9 Dec 31, 2025$166.7M9 Dec 31, 2024+8.7%
Raw materials$18.8M9 Dec 31, 2025$16.7M9 Dec 31, 2024+12.6%
Work in process$588.0K9 Dec 31, 2025$702.0K9 Dec 31, 2024−16.2%
Finished goods$161.8M9 Dec 31, 2025$149.3M9 Dec 31, 2024+8.3%

Properties, in its own words

We own or lease various properties in domestic and foreign locations. Our principal properties include our corporate offices, manufacturing facilities, distribution centers and our retail store. Our administrative, sales, and marketing operations are generally performed from our owned facilities in Nelsonville, Ohio. We operate our manufacturing operations through our owned facility in Chuzhou, China as well as several leased facilities in Puerto Rico and the Dominican Republic. We operate our distribution operations through an owned facility in Logan, Ohio and a leased facility in Reno, Nevada. Our retail store operates from an owned facility in Nelsonville, Ohio. Our owned properties have no major encumbrances. We believe our facilities are adequate for our current and near-term needs, and we will be able to locate additional facilities, as needed.

The following locations represent our major properties by segment:

The rest of Item 2

Wholesale: Nelsonville, Ohio; Logan, Ohio; Chuzhou, China; Reno, Nevada; Puerto Rico; Dominican Republic

Retail: Nelsonville, Ohio; Logan, Ohio; Chuzhou, China; Reno, Nevada; Puerto Rico; Dominican Republic

Contract Manufacturing: Nelsonville, Ohio; Chuzhou, China; Reno, Nevada; Puerto Rico

Item 2 of the 10-K filed Mar 11, 2026.18

The story

In 1932, William Brooks, joined by his brother F. M. "Mike" Brooks, founded The William Brooks Shoe Company in Nelsonville, Ohio. Both men had lost their jobs during the Great Depression when Godman Shoe Co. of Columbus went bankrupt. In search of opportunity, the brothers set up shop in a rent-free factory with lent equipment and what would eventually become Rocky Brands was born.

The company originally employed 50 to 100 workers with a production rate of 300 pairs of shoes per day. With a newly constructed addition and the installation of more equipment, by the mid-1930s the factory employed 225 people and production output increased to more than 2,000 pairs per day. During the 1940s and 1950s business continued to grow. While supplying more than one million pairs of shoes and boots for military conflicts such as World War II and the Korean War, the company built key relationships with leading footwear retailers.

But in 1958, William Brooks decided to sell the business to the Irving Drew Shoe Company of Lancaster, Ohio. His nephew, John Brooks, who had worked in the plant full-time since age 17, attempted to make a play for the family-run business, but his efforts were rebuffed. William Brooks refused to sell, telling his nephew the shoe industry had no future.

In 1975, the new owners were getting ready to sell or shut down the business. John Brooks, who stayed through the Irving Drew years as plant manager, bought the business back for $640,000, re-establishing The William Brooks Shoe Company in Nelsonville. John Brooks then brought his son, Mike Brooks, into the business as a product designer and manager. In 1977, Mike Brooks won an award for what now is called the original "Rocky boot," and the company paid $1,000 for a trademark and launched the Rocky brand.

As the company struggled in the early 1980s, the shoe market bounced back, and in 1983, the company began marketing occupational shoes, such as those worn by police officers and mail carriers, under the Rocky brand. It opened up new markets and new distribution methods. Sales rose and in 1988, the company reached $20 million in annual revenue.

Two years after the retirement of John Brooks in 1991, his son, Mike Brooks took the company public, spending nearly three-quarters of a million dollars in the process, changing the name to Rocky Shoes & Boots and initiating the company's initial public offering.

Rocky Shoes & Boots acquired EJ Footwear on December 6, 2004, for $87.7 million in cash and roughly $10 million in stock. The move brought Georgia Boot, Durango, and Lehigh Safety Shoes brands into Rocky's fold and added a licensed footwear brand in Dickies.

In 2006, Rocky Shoes & Boots changed its name to Rocky Brands, Inc. Following the name change Rocky Brands acquired comfort footwear Zumfoot shoes and Michelin footwear.

Read the full text

In February 2014 the company acquired Los Angeles based Creative Recreation for $11 million. In 2015, Creative Recreation's original owner Rich Cofinco was made creative director.

In 2021, Rocky Brands acquired Honeywell's performance and lifestyle footwear business for $230 million, including The Original Muck Boot Company, the neoprene boot brand Xtratuf, as well as the Servus, NEOS and Ranger footwear brands.

From Wikipedia’s article on Rocky Brands, shared under CC BY-SA 4.0.7

Leadership

Who has led Rocky Brands, and when. Pick a name to see everywhere that person has worked.

Board members and other officers (14)

Subsidiaries and ownership

Subsidiaries (Exhibit 21)

  • Rocky Brands Canada, Inc.,8

The subsidiaries the company lists in Exhibit 21 of its annual report, as filed.

Former names

  • ROCKY BRANDS, INC.May 17, 2005 to Oct 5, 20266
  • ROCKY SHOES & BOOTS INCAug 14, 1996 to May 22, 20066

Timeline

  1. Jul 28, 20268-K Results of operations45
  2. Jun 5, 20268-K Shareholder vote46
  3. May 18, 20268-K Other events47
  4. Apr 28, 20268-K Results of operations48
  5. Feb 24, 20268-K Results of operations; Other events49
  6. Oct 28, 20258-K Results of operations50
  7. Jul 29, 20258-K Results of operations51
  8. Jun 4, 20258-K Shareholder vote52
  9. Apr 29, 20258-K Results of operations53
  10. Feb 25, 20258-K Results of operations; Other events54
  11. Oct 30, 20248-K Results of operations55
  12. Jul 30, 20248-K Results of operations56
  13. Jun 5, 2017New chief executive Jason Brooks becomes CEO19
  14. Jan 6, 2014New chief executive David Sharp becomes CEO20
  15. 1932Founded Founded1

Calendar

Coming up

  1. Oct 27, 2026Reports results for the quarter ending Sep/202657

When it reported results

  1. Jul 28, 2026Reported quarterly or annual results45
  2. Apr 28, 2026Reported quarterly or annual results48
  3. Feb 24, 2026Reported quarterly or annual results49
  4. Oct 28, 2025Reported quarterly or annual results50
  5. Jul 29, 2025Reported quarterly or annual results51
  6. Apr 29, 2025Reported quarterly or annual results53
  7. Feb 25, 2025Reported quarterly or annual results54
  8. Oct 30, 2024Reported quarterly or annual results55

Upcoming dates from Nasdaq's calendar; past results from the company's 8-K filings (Item 2.02). The full markets calendar

Filings

395 filings to the SEC since October 2021: 5 annual reports, 15 quarterly reports, 37 major events, 268 insider forms, 23 large holders, 47 other. The latest 20:

  1. Oct 5, 20264 EDGAR
  2. Oct 5, 20264 EDGAR
  3. Oct 5, 20264 EDGAR
  4. Oct 5, 20264 EDGAR
  5. Oct 5, 20264 EDGAR
  6. Oct 5, 20264 EDGAR
  7. Oct 5, 20264 EDGAR
  8. Oct 5, 20264 EDGAR
  9. Aug 14, 2026SCHEDULE 13G/A EDGAR
  10. Aug 12, 20264 EDGAR
  11. Aug 7, 20264 EDGAR
  12. Aug 5, 2026144 EDGAR
  13. Aug 5, 20264 EDGAR
  14. Aug 5, 20264 EDGAR
  15. Aug 4, 2026144 EDGAR
  16. Aug 4, 2026144 EDGAR
  17. Aug 4, 202610-Q EDGAR
  18. Aug 4, 20264 EDGAR
  19. Aug 4, 20264 EDGAR
  20. Aug 3, 2026144 EDGAR

The 395 filings since October 2021 can be filtered by form type and year here when JavaScript is on.

Every filing from the last five years, summarized. The full record is on SEC EDGAR.

Insider trades

48 open-market trades by officers, directors and large owners since October 2021: 15 buys and 33 sales. Grants, option exercises and gifts are left out.

DateWhoTradeSharesPriceValueFiling
Aug 5, 2026Moore Robert Burton Jr.DirectorSale3,000$49.73$149.2KForm 4
Aug 4, 2026Jordan William LDirectorSale989$51.87$51.3KForm 4
Aug 4, 2026LOVELAND CURTIS AAssistant SecretarySale3,483$50.54$176.0KForm 4
Aug 4, 2026Hahn Robyn R.DirectorSale3,000$50.97$152.9KForm 4
Aug 3, 2026Finn Michael LDirectorSale3,000$50.97$152.9KForm 4
Jul 31, 2026Jordan William LDirectorSale2,011$48.48$97.5KForm 4
Jul 31, 2026Winbigler Tracie A.DirectorSale3,000$47.45$142.3KForm 4
Jul 30, 2026Haning G CourtneyDirectorSale3,000$49.06$147.2KForm 4
Jul 30, 2026Smith Dwight EricDirectorBuy500$48.63$24.3KForm 4
Jul 30, 2026LOVELAND CURTIS AAssistant SecretarySale3,000$49.62$148.9KForm 4
Nov 26, 2025Hahn Robyn R.DirectorSale3,800$30.56$116.1KForm 4
Nov 6, 2025Smith Dwight EricDirectorBuy300$28.98$8.7KForm 4
Nov 6, 2025LOVELAND CURTIS AAssistant SecretarySale6,937$32.42$224.9KForm 4
Nov 5, 2025Wortham ByronSVP Georgia Boot & DurangoSale6,600$29.90$197.3KForm 4
Nov 5, 2025LOVELAND CURTIS AAssistant SecretarySale3,619$29.40$106.4KForm 4
Nov 4, 2025LOVELAND CURTIS AAssistant SecretarySale4,000$28.80$115.2KForm 4
Sep 4, 2025Finn Michael LDirectorSale5,000$29.73$148.7KForm 4
Sep 3, 2025Hahn Robyn R.DirectorSale2,500$29.52$73.8KForm 4
Sep 2, 2025Winbigler Tracie A.DirectorSale5,000$29.95$149.8KForm 4
Aug 29, 2025Jordan William LDirectorSale5,000$30.10$150.5KForm 4

All 48 trades can be filtered by person here when JavaScript is on.

From Forms 4 filed with the SEC.

Major holders

Investors who own more than 5% of the shares must tell the SEC: a 13D if they may seek to influence the company, a 13G if they hold passively.

Executive pay

What the company paid its top executives, from the summary compensation table in its proxy statement. Total pay includes salary, bonus, stock and option awards and other pay, as the company valued them.

YearExecutiveAgeSalaryTotal pay
2025Jason Brooks$556.2K$1.3M66
2025Thomas D. Robertson$440.0K$990.6K66
2025Byron Wortham$283.0K$568.5K66
2024ChairmanPresident and$540.0K$799.3K66
2024Chief Operating OfficerChief$412.0K$617.9K66
2024SVP of Georgia Boot &$276.0K$425.6K66
2023Chief Executive Officer$540.0K$670.3K66
2023Financial Officer and Treasurer$400.0K$516.2K66
2023Durango Brands$272.0K$372.1K66

Held by these funds

The largest holders among investment managers' 13F reports for the quarter ending Jun 30, 2026, the top 25 of 100. Change is in shares since the quarter before.

FundSharesValueShare of the fundChange
Alliancebernstein L.P.647,175$25.1M0.0%+108,921
BlackRock, Inc.522,760$21.6M0.0%+29,464
Dimensional Fund Advisors LP514,294$21.2M0.0%+8,815
Raymond James Financial Inc510,171$21.0M0.0%+22,876
Vanguard Capital Management LLC320,446$13.2M0.0%+144
American Century Companies Inc234,931$9.7M0.0%−23,752
Geode Capital Management, LLC192,492$7.9M0.0%+19,924
Aristides Capital LLC185,944$7.7M2.0%+73,200
Russell Investments Group, Ltd.159,508$6.6M0.0%+36,536
Crawford Investment Counsel Inc157,856$6.5M0.1%+790
North Star Investment Management Corp.154,175$6.4M0.3%No change
State Street Corp150,507$6.2M0.0%+4,697
Deprince Race & Zollo Inc140,101$5.8M0.1%+32,803
Oberweis Asset Management Inc/117,700$4.9M0.1%−300
Bridgeway Capital Management, LLC113,302$4.7M0.1%−1,304
Northern Trust Corp109,091$4.5M0.0%+2,219
Allspring Global Investments Holdings, LLC105,390$4.4M0.0%+19,927
Franklin Resources Inc106,248$4.4M0.0%New
Renaissance Technologies LLC80,235$3.3M0.0%−3,300
Bank of New York Mellon Corp69,263$2.9M0.0%+3,201
Two Sigma Investments, LP69,224$2.9M0.0%+32,529
Segall Bryant & Hamill, LLC65,357$2.7M0.0%+23,957
Morgan Stanley64,619$2.7M0.0%+10,943
D. E. Shaw & Co., Inc.63,844$2.6M0.0%−26,953
Vanguard Portfolio Management LLC57,458$2.4M0.0%−3,676

13F reports cover disclosed long positions in U.S. stocks only.

Members of Congress who traded it

2 trades disclosed by members of Congress. “Vs S&P since” is the stock’s change since the trade minus the S&P 500’s.

DateMemberTradeAmountVs S&P sinceFiling
Sep 10, 2019Harley E. Rouda, HouseSale$100,001 - $250,000+103.1%Report
Apr 5, 2019Harley E. Rouda, HouseSale$100,001 - $250,000+85.1%Report

Members report amounts as ranges, not exact figures. Returns are price-only (no dividends).

SEC filer profile

How Rocky Brands is registered with the Securities and Exchange Commission, from its EDGAR record and the cover page of its latest annual report.

  • Name on EDGARROCKY BRANDS, INC.2
  • CIK0000895456
  • Employer ID (EIN)31-136404618
  • Filer statusAccelerated filer not an emerging growth company; a smaller reporting company; not a shell company18
  • Incorporated inOhio18
  • Fiscal year endsDecember 312
  • Industry code (SIC)3140 Footwear, (No Rubber)2
  • SEC reviewing officeOffice of Manufacturing, Division of Corporation Finance2
  • Business address39 East Canal Street, Nelsonville, OH 457642
  • Phone61475319512
  • Shares outstanding7,491,911 as of Jul 31, 202616
  • Public float$159.6M as of Jun 30, 202518
  • AuditorDELOITTE & TOUCHE LLP, Columbus, Ohio PCAOB ID 34; it also attests to the company’s internal control over financial reporting18
  • On EDGAR sinceMay 14, 19962
  • Filings1,444 in all: 4 (817), 8-K (187), SC 13G/A (95), 10-Q (92), SC 13G (33), DEF 14A (30), 144 (29), 10-K (28)2
    All 38 form types

    3 (18), UPLOAD (16), ARS (15), CORRESP (10), S-8 (7), SCHEDULE 13G/A (6), 4/A (5), 5 (5), 8-K/A (5), SC 13D (5), SC 13D/A (5), 10-Q/A (4), S-3 (4), S-3/A (4), 10-K/A (3), DEFA14A (3), 10-K405 (2), 3/A (2), 424B5 (2), EFFECT (2), 424B3 (1), 424B4 (1), 8-A12B (1), 8-A12G (1), 8-A12G/A (1), PRE 14A (1), RW (1), S-2 (1), S-2/A (1), SCHEDULE 13G (1)

  • Latest filingsAnnual report (10-K) Mar 11, 2026
    Quarterly report (10-Q) Aug 4, 2026
    Proxy statement (DEF 14A) Apr 28, 2026
    Latest 8-K (8-K) Jul 28, 2026

Securities registered for trading

ClassSymbolExchange
Common Stock – No Par ValueRCKYNASDAQ

From the cover page of the 10-K filed Mar 11, 2026 (Section 12(b) of the Exchange Act).18

Risk factors and legal proceedings

The risks Rocky Brands names in Item 1A of its 10-K filed Mar 11, 2026: 33 risks under these headings, as written.18

  • Business Risks
  • Expanding our brands into new footwear and apparel markets may be difficult and expensive, and if we are unable to successfully continue such expansion, our brands may be adversely affected, and we may not achieve our planned sales growth.
  • A majority of our products are produced outside the continental U.S. where we are subject to the risks of international commerce and other international conditions.
  • Our success depends on our ability to anticipate consumer trends.
  • We depend on a limited number of suppliers for key production materials, and disruptions in the supply of such materials could interrupt product manufacturing and increase product costs.
  • The emergence or persistence of geopolitical instability may disrupt the global economy, the impacts of which may negatively impact our business, financial, condition and results of operations.
  • Our outdoor and insulated products are seasonal and sales of such products are sensitive to weather conditions.
  • Our business could suffer if our third-party manufacturers violate labor, environmental or other applicable laws or fail to conform to generally accepted ethical standards.
  • The growth of our business will be dependent upon the availability of adequate capital.
  • Our current level of indebtedness could adversely affect our business by increasing our borrowing costs and decreasing our overall business flexibility.
  • We must comply with the restrictive covenants contained in our credit facilities.
  • Interest rate increases could adversely affect our financial results.
The other 22 risks
  • We face intense competition, including competition from companies with significantly greater resources than ours, and if we are unable to compete effectively with these companies, our market share may decline and our business could be harmed.
  • Our financial success is influenced by the success of our wholesale customers, and the loss of such a key customer could have a material adverse effect on our financial condition and results of operations.
  • Certain of our larger wholesale customers may develop and manufacture competing products under their own brands and reduce purchases of our branded products.
  • We currently manufacture a portion of our products, and we may not be able to do so in the future at costs that are competitive with those of competitors who source their goods.
  • We rely on our distribution centers in Ohio and Nevada and manufacturing facilities in the Dominican Republic, Puerto Rico, and China and if there is a natural disaster or other serious disruption at any of these facilities, we may be unable to deliver merchandise effectively to our retailers and consumers.
  • If our efforts to establish and protect our trademarks, patents and other intellectual property are unsuccessful, the value of our brands could suffer.
  • An impairment of intangibles, including goodwill, could have an adverse impact to the Company’s results of operations.
  • Our success depends on our ability to forecast sales.
  • Our dividend policy may change.
  • Industry Risks
  • Because the footwear market is sensitive to decreased consumer spending and slow economic cycles, if general economic conditions deteriorate, many of our customers may significantly reduce their purchases from us or may not be able to pay for our products in a timely manner.
  • The continued shift in the third-party marketplace from traditional independent retailers to large mass merchandisers may result in decreased margins.
  • The shift in consumer shopping to online retailers and our increased online sales pose various risks which may negatively impact our business.
  • General Risk Factors
  • Changes to U.S. tax, tariff and import/export regulations may have a negative effect on global economic conditions, financial markets and our business.
  • We are implementing a new enterprise resource planning system, and challenges with the implementation of the system may have an adverse effect on our business, financial condition results of operations
  • There are risks, including stock market volatility, inherent in owning our common stock.
  • Disruption of our information technology systems and e-commerce platforms could adversely affect our business
  • A cybersecurity breach could have a material adverse effect on our business and reputation.
  • Compliance with data privacy and marketing laws may subject us to increased additional costs, and our ability to effectively engage customers via personalized marketing may be impacted, all of which may have a material adverse effect on our business operations.
  • We are subject to certain environmental and other regulations.
  • We are subject to periodic litigation and other regulatory proceedings, which could result in the unexpected expenditure of time and resources.
  • Loss of services of our key personnel could adversely affect our business.
  • We may use artificial intelligence in our business, which could result in reputational harm, competitive harm, and legal liability, and adversely affect our business, results of operations and financial condition.

Legal proceedings

We are, from time to time, a party to litigation which arises in the normal course of our business. Although the ultimate resolution of pending proceedings cannot be determined, in the opinion of management, the resolution of these proceedings in the aggregate will not have a material adverse effect on our financial position, results of operations, or liquidity. A discussion of legal matters is found in Note 17 - Commitments and Contingencies of our Consolidated Financial Statements included in Part II - Item 8. Financial Statements and Supplementary Data of this Annual Report on Form 10-K.

The opening of Item 3, Legal Proceedings.18

Sources

The numbers on this page point here. Each one links to the record it came from.

  1. 1
  2. 2
  3. 3
  4. 4
  5. 5
    Company websiteRocky Brands logo
  6. 6
  7. 7
  8. 8
  9. 9
  10. 10
  11. 11
  12. 12
  13. 13
  14. 14
  15. 15
  16. 16
  17. 17
  18. 18
  19. 19
  20. 20
  21. 21
  22. 22
  23. 23
  24. 24
  25. 25
  26. 26
  27. 27
  28. 28
  29. 29
  30. 30
  31. 31
  32. 32
  33. 33
  34. 34
  35. 35
  36. 36
  37. 37
  38. 38
  39. 39
  40. 40
  41. 41
  42. 42
  43. 43
  44. 44
  45. 45
  46. 46
  47. 47
    SEC EDGAROther events
  48. 48
  49. 49
  50. 50
  51. 51
  52. 52
  53. 53
  54. 54
  55. 55
  56. 56
  57. 57
  58. 58
  59. 59
  60. 60
  61. 61
  62. 62
  63. 63
  64. 64
  65. 65
  66. 66