
SFL on NYSE

SFL Corporation Ltd.
Logo: sflcorp.com4
Bermuda-incorporated maritime and offshore asset owner based in Hamilton, founded in 20031
In its 2026 annual report (Form 20-F) the company says: “We are an international ship owning and chartering company with a large and diverse asset base across the maritime, shipping and offshore asset classes and business sectors. We also hold an equity interest in an associated company that owns four leased-in container vessels.”7 Its chief executive is Ole B. Hjertaker (since 2009).1 Its shares trade on NYSE under the symbol SFL.1
Price unavailable
Last updated Oct 21, 2026.
Overview
Compare with Global Ship Lease, TSAKOS ENERGY NAVIGATION LTD or Pangaea Logistics Solutions Ltd., or pick any stock.
- TickerSFL on NYSE1
- IndustryDeep Sea Foreign Transportation of Freight1
- HeadquartersHamilton1
- Websitewww.sflcorp.com
- Business address14 Par-La-Ville Road, Hamilton, Hm 08, D0 00000-00006
- Filer categoryLarge accelerated filer6
- Legal formExempted Companies Limited by Shares3
- LEI549300RLYYPSB0C7RH773
- StatusActive3
- LEI statusIssued and current3
- Registered addressPar-La-Ville Place, HM 08 Hamilton, Bermuda3
- Registered withRegistrar of Companies (Ministry of Economic Development), 342963
See how the biggest companies compare on our leaderboards
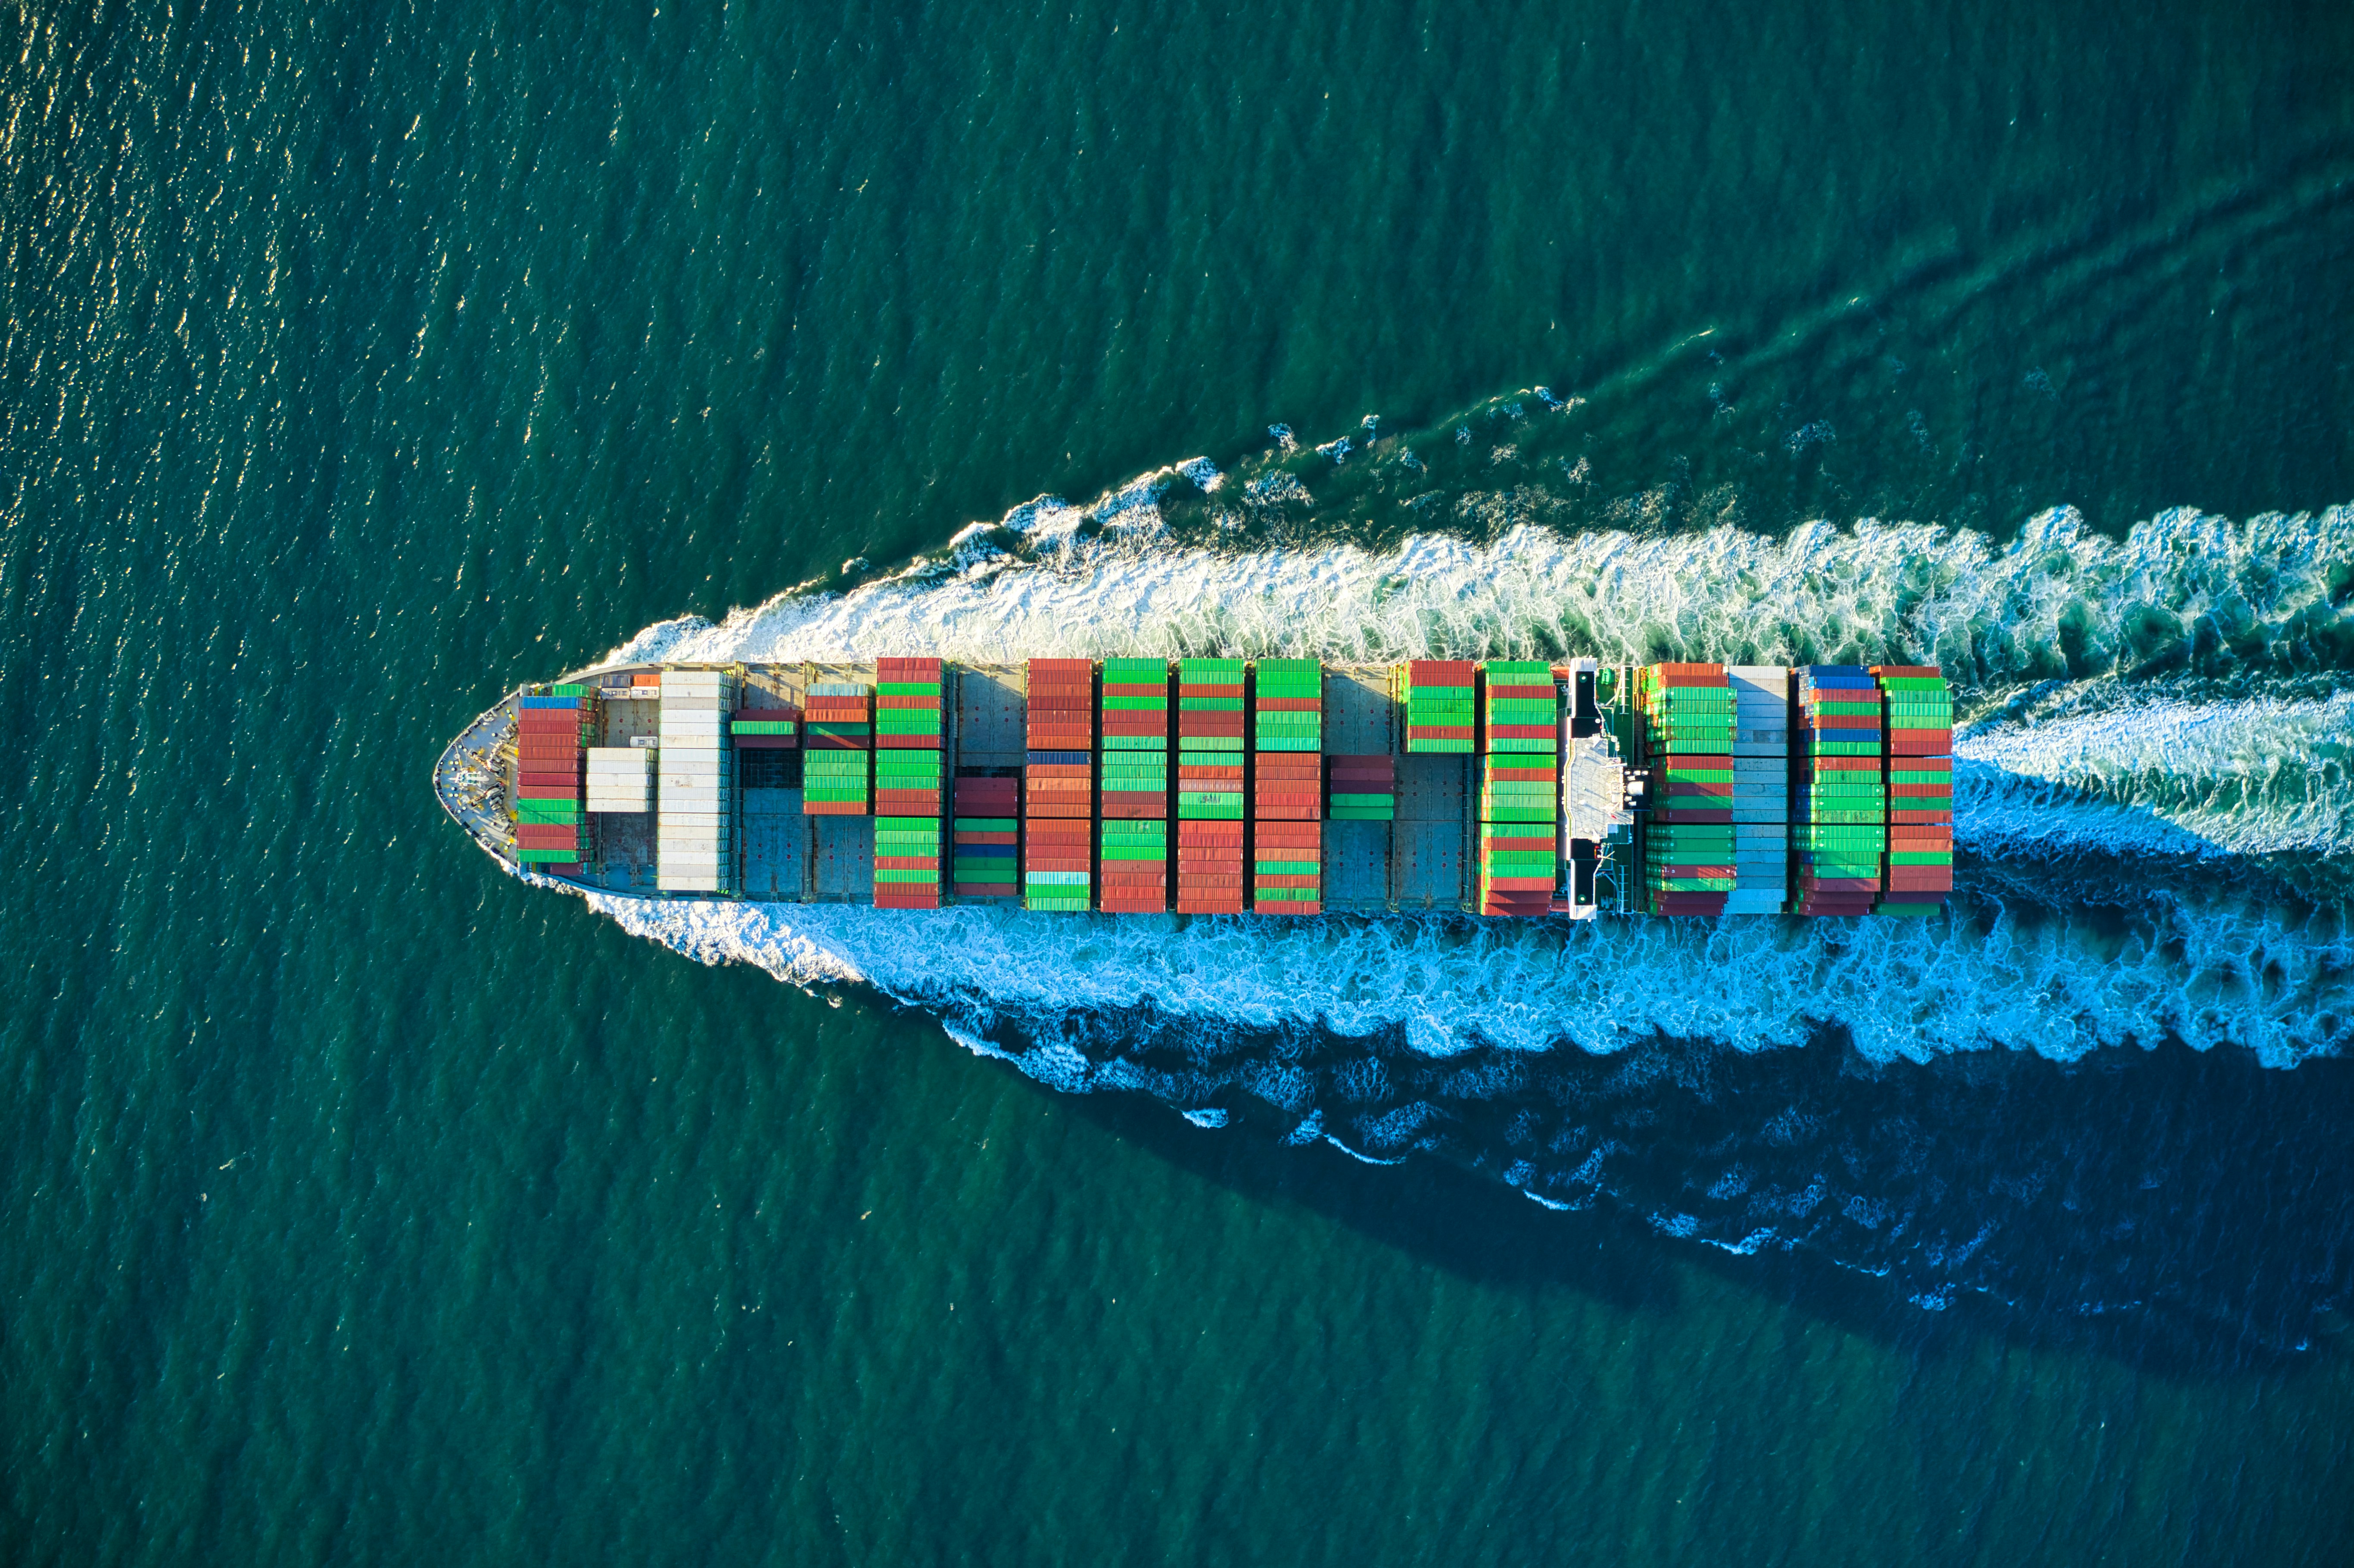
We are SFL Corporation Ltd., a company incorporated under the laws of Bermuda on October 10, 2003, as a Bermuda exempted company under the Bermuda Companies Law of 1981 (Company No. EC-34296). We are engaged primarily in the ownership and operation of vessels and offshore related assets, and we are also involved in the charter, purchase and sale of assets. Our registered and principal executive offices are located at Par-la-Ville Place, 14 Par-la-Ville Road, Hamilton, HM 08, Bermuda, and our telephone number is (441) 295-9500. Our website is www.sflcorp.com. The SEC maintains an Internet site that contains reports, proxy and information statements, and other information regarding issuers that file electronically with the SEC. The address of the SEC’s internet site is www.sec.gov. None of the information contained on these websites is incorporated into or forms a part of this annual repor…7 From its latest annual report
Financials
From the company’s reports to the SEC. Every number links to the filing it came from.
Key numbers, fiscal 2025
Where the money goes
Where each dollar of revenue went, fiscal 2025
- Other costs100¢$731.2M
- Income tax0¢$1.9M
Out of $733.0M in revenue.5 The company lost money this year.
Where each dollar of operating cash went, fiscal 2025
- Dividends paid47¢$125.1M
- Share buybacks4¢$10.0M
- Kept or used elsewhere49¢$132.0M
Out of $267.1M of cash from operations.5
Financial statements
No quarterly figures reported.
Every line of the income statement as filed: the last 3 fiscal years, latest first.5
| Period ending | 2025-12-31 | 2024-12-31 | 2023-12-31 |
|---|---|---|---|
| Time charter revenues | $602.2M | $619.4M | $544.4M |
| Voyage charter and pool revenues | $14.8M | $18.9M | $33.6M |
| Drilling contract revenues | $96.3M | $236.7M | $146.9M |
| Interest income sales-type and leaseback assets | $951.0K | $2.4M | $6.2M |
| Profit sharing revenues | $5.6M | $16.7M | $13.2M |
| Other operating income | $13.3M | $10.3M | $8.0M |
| Total operating revenues | $733.0M | $904.4M | $752.3M |
| (Loss)/Gain on sale of assets and settlement of charters, net | -$7.2M | $5.4M | $18.7M |
| Vessel and rig operating expenses | $301.8M | $343.3M | $293.8M |
| Depreciation | $235.0M | $239.2M | $214.1M |
| Vessel impairment charge | $34.1M | $0 | $7.4M |
| Administrative expenses | $18.3M | $20.6M | $15.6M |
| Total operating expenses | $589.2M | $603.1M | $530.8M |
| Net operating income | $136.7M | $306.7M | $240.2M |
| Interest income long-term loans to associated companies | $4.6M | $4.6M | $4.6M |
| Interest income other | $10.2M | $9.2M | $9.1M |
| Interest expense | -$180.5M | -$183.0M | -$167.0M |
| Loss on investments in debt and equity securities | -$39.0K | -$854.0K | -$1.9M |
| Other financial items, net | $2.2M | $1.8M | -$486.0K |
| Equity in earnings of associated companies | $2.4M | $2.8M | $2.8M |
| (Loss)/Income before taxes | -$24.5M | $141.3M | $87.3M |
| Tax expense | -$1.9M | -$10.6M | -$3.3M |
| Net (loss)/income | -$26.4M | $130.7M | $83.9M |
| Basic (loss)/earnings per share (in dollars per share) | -$0.20 | $1.01 | $0.67 |
| Weighted average number of shares outstanding, basic (in shares) | 133.1M shares | 129.4M shares | 126.2M shares |
| Diluted (loss)/earnings per share (in dollars per share) | -$0.20 | $1.01 | $0.66 |
| Weighted average number of shares outstanding, diluted (in shares) | 133.1M shares | 130.0M shares | 126.6M shares |
| Cash dividend per share declared and paid (in dollars per share) | $0.94 | $1.07 | $0.97 |
No quarter-by-quarter statement was filed.
No quarterly figures reported.
Every line of the balance sheet as filed: the last 4 fiscal years (annual) or 4 quarters (quarterly), latest first.5
| Period ending | 2025-12-31 | 2024-12-31 | 2023-12-31 | 2018-04-30 |
|---|---|---|---|---|
| Cash and cash equivalents | $150.8M | $134.6M | $165.5M | |
| Investment in debt and equity securities | $4.1M | $3.7M | ||
| Trade accounts receivable | $11.6M | $36.8M | ||
| Inventories | $13.8M | $17.4M | ||
| Prepaid expenses and accrued income | $18.7M | $17.1M | ||
| Investment in sales-type leases, current portion | $0 | $35.1M | ||
| Financial instruments at fair value, current portion | $0 | $121.0K | ||
| Total current assets | $259.2M | $316.0M | ||
| Vessels, rigs and equipment, net | $3.1B | $3.6B | ||
| Capital improvements in progress and newbuildings | $181.1M | $162.3M | ||
| Investment in associated companies | $15.8M | $16.4M | ||
| Loans and long-term receivables from related parties including associates | $45.0M | $45.0M | ||
| Financial instruments at fair value, long-term portion | $14.1M | $15.5M | ||
| Other long-term assets | $294.0K | $294.0K | ||
| Total assets | $3.6B | $4.1B | ||
| Short-term debt and current portion of long-term debt | $605.9M | $689.0M | ||
| Trade accounts payable | $7.3M | $34.3M | ||
| Accrued expenses | $51.9M | $51.4M | ||
| Financial instruments at fair value, current portion | $0 | $14.9M | ||
| Total current liabilities | $710.3M | $827.9M | ||
| Long-term debt | $2.0B | $2.2B | ||
| Financial instruments at fair value, long-term portion | $6.1M | $103.0K | ||
| Other long-term liabilities | $277.0K | $970.0K | ||
| Total liabilities | $2.7B | $3.0B | ||
| Share capital | $1.5M | $1.5M | ||
| Additional paid-in capital | $718.0M | $716.2M | ||
| Treasury stock | -$20.2M | -$10.2M | ||
| Contributed surplus | $292.6M | $417.7M | ||
| Accumulated other comprehensive income | -$4.5M | $3.2M | $4.5M | |
| Retained earnings | -$26.4M | $0 | ||
| Total stockholders' equity | $960.9M | $1.1B | $1.0B | |
| Total liabilities and stockholders' equity | $3.6B | $4.1B | ||
| Share capital, par value (in dollars per share) | $0.01 | $0.01 | $0.01 | |
| Share capital, authorized (in shares) | 300.0M shares | 300.0M shares | ||
| Share capital, shares issued (in shares) | 146.9M shares | 146.8M shares | ||
| Share capital, shares outstanding (in shares) | 144.6M shares | 145.7M shares |
Cash flow is reported year to date, not quarter by quarter, so there are no separate quarterly figures.
Every line of the cash flow as filed: the last 3 fiscal years, latest first.5
| Period ending | 2025-12-31 | 2024-12-31 | 2023-12-31 |
|---|---|---|---|
| Net (loss)/income | -$26.4M | $130.7M | $83.9M |
| Depreciation | $235.0M | $239.2M | $214.1M |
| Amortization of deferred charges | $8.1M | $7.6M | $7.7M |
| Amortization of deferred charter revenue | $363.0K | -$1.1M | -$1.4M |
| Vessel impairment charge | $34.1M | $0 | $7.4M |
| Adjustment of derivatives to fair value recognized in net income | $4.6M | $4.7M | $8.4M |
| Capitalized lease debt financing interest | $8.1M | $6.7M | $2.9M |
| Equity in earnings of associated companies | -$2.4M | -$2.8M | -$2.8M |
| Gain on sale of assets, net | -$15.8M | -$5.4M | -$18.7M |
| Repayments from investment in sales-type leases and leaseback assets | $4.0M | $8.6M | $13.9M |
| Loss on repurchase of bonds | $144.0K | $1.3M | $540.0K |
| Other, net | $4.2M | -$7.3M | $1.0M |
| Trade accounts receivable | $25.3M | $4.3M | -$20.9M |
| Due to/ from related parties | -$1.7M | -$3.2M | $1.8M |
| Other current assets | $7.4M | -$31.2M | -$3.1M |
| Inventories | $3.6M | -$5.7M | $4.7M |
| Prepaid expenses and accrued income | -$5.0M | -$2.0M | $638.0K |
| Trade accounts payable | -$27.0M | $4.0M | $22.4M |
| Accrued expenses and other current liabilities | $10.4M | $21.2M | $20.7M |
| Net cash provided by operating activities | $267.1M | $369.9M | $343.1M |
| Purchase of vessels, capital improvements and other additions | -$70.5M | -$644.9M | -$264.4M |
| Proceeds from sale of assets | $258.6M | $22.7M | $156.2M |
| Net amounts received from associated companies | $0 | $2.8M | $2.9M |
| Collateral deposits received on swap agreements | $0 | $2.1M | $1.7M |
| Other investments and long-term assets, net | $0 | -$300.0K | -$275.0K |
| Net cash provided by/(used in) investing activities | $188.1M | -$617.5M | -$103.9M |
| Repayments of lease obligation liability | $0 | -$419.3M | -$53.7M |
| Proceeds from issuance of short-term and long-term debt | $244.0M | $1.4B | $944.6M |
| Repayments of short-term and long-term debt | -$527.3M | -$556.7M | -$781.1M |
| Repurchase of bonds | -$11.1M | -$133.1M | -$205.8M |
| Debt fees paid | -$3.2M | -$13.7M | -$12.4M |
| Principal settlements of cross currency swaps, net | -$6.3M | -$16.5M | -$20.4M |
| Cash received/(paid) for shares issued or repurchased | -$10.0M | -$10.2M | |
| Cash received/(paid) for shares issued or repurchased | $96.2M | ||
| Cash dividends paid | -$125.1M | -$138.5M | -$123.0M |
| Net cash provided by/(used in) financing activities | -$439.0M | $216.7M | -$262.1M |
| Net change in cash and cash equivalents | $16.3M | -$30.9M | -$22.9M |
| Interest paid on debt, swaps and leases, net of capitalized interest | $161.7M | $161.2M | $148.5M |
| Taxes paid | $2.8M | $8.3M | $2.0M |
No quarter-by-quarter statement was filed.
Corporate structure
SFL Corporation Ltd. sits at the top of its group. 26 entities, 2 countries on record. Switch between the flow chart and the network, and select any entity to see its details.
Major holders of SFL Corporation Ltd.
- DIMENSIONAL FUND ADVISORS LP Filed SCHEDULE 13G/A on SFL Corporation Ltd., latest Jul 15, 2025 (2 filings since Feb 9, 2024)
- BlackRock Filed SCHEDULE 13G/A on SFL Corporation Ltd., latest Apr 24, 2025 (2 filings since Feb 4, 2025)
- HEMEN HOLDING LTD Filed SC 13D/A on SFL Corporation Ltd., latest Jul 30, 2024
- DNB Bank ASA Filed SCHEDULE 13G on SFL Corporation Ltd., latest Jan 12, 2024 (2 filings since Feb 11, 2022)
- SFL Corporation Ltd. Hamilton, Bermuda
- SFL Axia Inc. Subsidiary · Hamilton, Bermuda
- SFL BULK HOLDING LTD. Subsidiary · Oslo, Norway
- SFL Capital II Ltd. Subsidiary · Hamilton, Bermuda
- SFL Chemical Tanker III Inc. Subsidiary · Hamilton, Bermuda
- SFL Chemical Tanker IV Inc. Subsidiary · Hamilton, Bermuda
- SFL CROLLY INC. Subsidiary · Oslo, Norway
- SFL Doxa Inc. Subsidiary · Hamilton, Bermuda
- SFL HUDSON INC Subsidiary · Oslo, Norway
- SFL KENAI INC. Subsidiary · Oslo, Norway
- SFL LOIRE INC. Subsidiary · Hamilton, Bermuda
- SFL Mana Inc. Subsidiary · Hamilton, Bermuda
- SFL MANAGEMENT AS Subsidiary · Oslo, Norway
- SFL Sabine Inc. Subsidiary · Hamilton, Bermuda
- SFL SARAT INC. Subsidiary · Hamilton, Bermuda
- SFL SEINE INC. Subsidiary · Hamilton, Bermuda
- SFL SHIVLING INC. Subsidiary · Hamilton, Bermuda
- SFL SKARSTIND INC. Subsidiary · Hamilton, Bermuda
- SFL SOMME INC. Subsidiary · Hamilton, Bermuda
- SFL TAURION INC. Subsidiary · Hamilton, Bermuda
- SFL TEU CAPITAL LTD. Subsidiary · Oslo, Norway
- SFL Trinity Inc. Subsidiary · Hamilton, Bermuda
- SFL Tyhi Inc. Subsidiary · Hamilton, Bermuda
- SFL WISDOM INC. Subsidiary · Oslo, Norway
- SFL YUKON INC Subsidiary · Oslo, Norway
- SFL ZAMBEZI INC. Subsidiary · Oslo, Norway
Built from parent and subsidiary links from GLEIF, the Global Legal Entity Identifier Foundation (CC0); major holders from Schedules 13D and 13G. Each entity in the chart links to its source.
What it owns
What SFL Corporation Ltd. reports owning in its annual reports to the SEC: buildings, land and equipment, real estate and locations, investments, intangible assets and inventory, at the end of its latest fiscal year and a year before.
Property and equipment
Investments
| Item | Latest | A year before | Change |
|---|---|---|---|
| Cash and cash equivalents | $150.8M5 Dec 31, 2025 | $134.6M5 Dec 31, 2024 | +12.1% |
| Equity securities at fair value | $4.1M5 Dec 31, 2025 | $3.7M5 Dec 31, 2024 | +11.0% |
| Stakes in other companies (equity method) | $15.8M5 Dec 31, 2025 | $16.4M5 Dec 31, 2024 | −3.4% |
Inventory
Leadership
Who has led SFL Corporation Ltd., and when. Pick a name to see everywhere that person has worked.
Chief executive
Chief financial officer
- Chief executive officerOle B. Hjertaker Jul 2009 to now14
- Chief financial officerAksel Olesen Mar 18, 2026 to now15
Board members and other officers (7)
- Board memberOle B. Hjertaker Mar 18, 2026 to now16
- Board memberJan Erik Klepsland Mar 19, 2026 to now17
- Board memberKornelis Jan Willem Cordia Mar 20, 2026 to now18
- Board memberGeorge William Homan-Russell Mar 31, 2026 to now19
- Board memberKathrine Astrup Fredriksen Apr 16, 2026 to now20
- Board memberGary Vogel Apr 24, 2026 to now21
- Board memberJames O'Shaughnessy Sep 14, 2026 to now22
Former names
- Ship Finance International LTDMay 21, 2004 to Aug 20, 20196
Timeline
Calendar
Coming up
- Nov 11, 2026Reports results for the quarter ending Sep/202623
Upcoming dates from Nasdaq's calendar; past results from the company's 8-K filings (Item 2.02). The full markets calendar
Filings
126 filings to the SEC since October 2021: 5 annual reports, 8 insider forms, 7 large holders, 106 other. The latest 20:
- Oct 13, 20266-K EDGAR
- Oct 7, 20266-K EDGAR
- Oct 5, 20266-K EDGAR
- Sep 14, 20263 EDGAR
- Sep 11, 20266-K EDGAR
- Aug 26, 20266-K EDGAR
- Aug 26, 20266-K EDGAR
- May 13, 20266-K EDGAR
- May 12, 20266-K EDGAR
- May 12, 20266-K EDGAR
- Apr 30, 20266-K EDGAR
- Apr 24, 20263 EDGAR
- Apr 16, 20263 EDGAR
- Apr 8, 20266-K EDGAR
- Mar 31, 20263 EDGAR
- Mar 27, 20266-K EDGAR
- Mar 20, 20263 EDGAR
- Mar 19, 20263 EDGAR
- Mar 18, 20263 EDGAR
- Mar 18, 20263 EDGAR
The 126 filings since October 2021 can be filtered by form type and year here when JavaScript is on.
Every filing from the last five years, summarized. The full record is on SEC EDGAR.
Major holders
Investors who own more than 5% of the shares must tell the SEC: a 13D if they may seek to influence the company, a 13G if they hold passively.
- DIMENSIONAL FUND ADVISORS LPSCHEDULE 13G/A, 2 filings Feb 9, 2024 to Jul 15, 202524
- BlackRockSCHEDULE 13G/A, 2 filings Feb 4, 2025 to Apr 24, 202525
- HEMEN HOLDING LTDSC 13D/A, 1 filing Jul 30, 202426
- DNB Bank ASASCHEDULE 13G, 2 filings Feb 11, 2022 to Jan 12, 202427
Members of Congress who traded it
1 trades disclosed by members of Congress. “Vs S&P since” is the stock’s change since the trade minus the S&P 500’s.
| Date | Member | Trade | Amount | Vs S&P since | Filing |
|---|---|---|---|---|---|
| Dec 31, 2025 | J. French HillRepublican, House | Sale | $15,001 - $50,000 | −47.8% | Report |
Members report amounts as ranges, not exact figures. Returns are price-only (no dividends).
SEC filer profile
How SFL Corporation Ltd. is registered with the Securities and Exchange Commission, from its EDGAR record and the cover page of its latest annual report.
- Name on EDGARSFL Corp Ltd.2
- CIK0001289877
- Filer statusLarge accelerated filer not an emerging growth company; not a shell company7
- Incorporated inBermuda7
- Industry code (SIC)4412 Deep Sea Foreign Transportation of Freight2
- SEC reviewing officeOffice of Energy & Transportation, Division of Corporation Finance2
- Business address14 Par-La-Ville Road, Hamilton, Hm 08, D0 00000-00002
- Phone441-295-95002
- Shares outstanding144,562,927 shares as of Dec 31, 20257
- AuditorErnst & Young AS, Oslo, Norway PCAOB ID 1572; it also attests to the company’s internal control over financial reporting7
- On EDGAR sinceMay 21, 20042
- Filings592 in all: 6-K (421), 20-F (22), UPLOAD (18), CORRESP (17), 424B5 (16), SC 13G/A (14), 424B2 (12), SC 13D/A (11)2
All 30 form types
SC 13G (9), 3 (8), F-3ASR (8), 424B7 (5), FWP (5), 6-K/A (3), EFFECT (2), F-3 (2), F-3D (2), POSASR (2), SC 13D (2), SCHEDULE 13G (2), SCHEDULE 13G/A (2), 144 (1), 424B1 (1), 424B3 (1), 8-A12B (1), CERTNYS (1), F-1 (1), F-3/A (1), F-4 (1), F-4/A (1)
- Latest filingsAnnual report (20-F) Mar 16, 2026
Securities registered for trading
| Class | Symbol | Exchange |
|---|---|---|
| Common Shares, $0.01 Par Value | SFL | New York Stock Exchange |
From the cover page of the 20-F filed Mar 16, 2026 (Section 12(b) of the Exchange Act).7
Links
- Websitewww.sflcorp.com1
- WikidataQ141592559
- SEC EDGARCIK 1289877
Sources
The numbers on this page point here. Each one links to the record it came from.
- 1WikidataSFL Corporation Ltd. on Wikidata
- 2
- 3
- 4Company websiteSFL Corporation Ltd. logo
- 5
- 6
- 7
- 8
- 9
- 10
- 11
- 12
- 13
- 14Wikidata and SEC EDGAROle B. Hjertaker, Chief executive officer
- 15
- 16SEC EDGAROle B. Hjertaker, Board member
- 17SEC EDGARJan Erik Klepsland, Board member
- 18
- 19
- 20
- 21SEC EDGARGary Vogel, Board member
- 22SEC EDGARJames O'Shaughnessy, Board member
- 23NasdaqNasdaq calendar
- 24
- 25
- 26
- 27