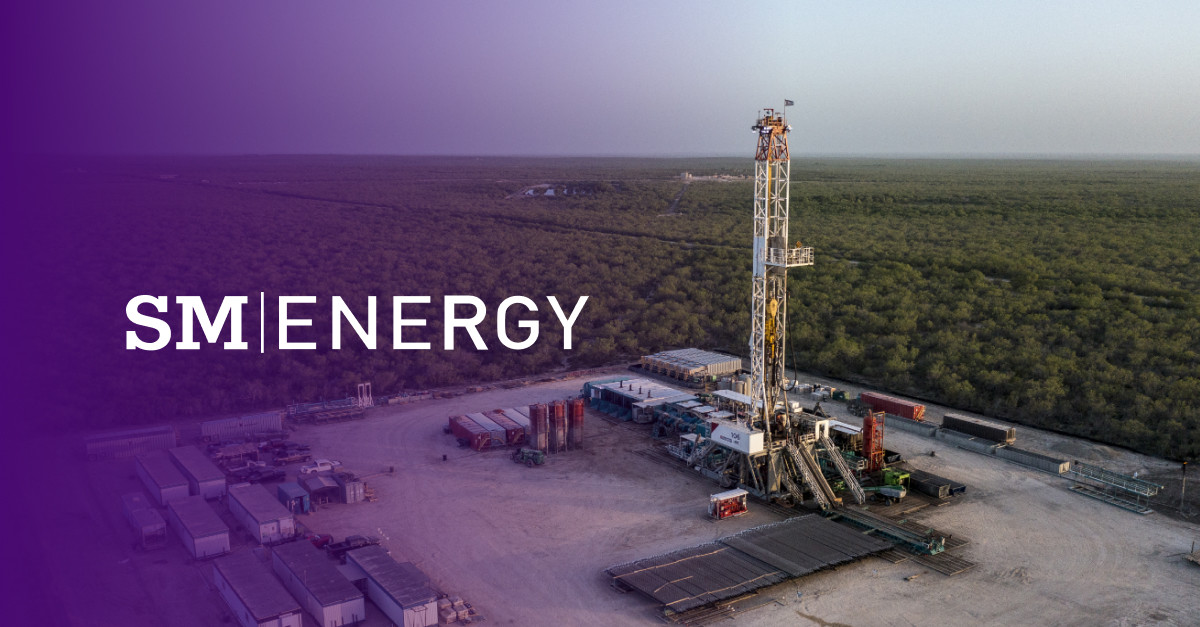
Company engaged in hydrocarbon exploration headquartered in Denver, Colorado
SM Energy Company is a company engaged in hydrocarbon exploration. It is organized in Delaware and headquartered in Denver, Colorado. The company's assets are in the Eagle Ford Group/South Texas (51% of reserves and 48% of 2024 production), the Permian Basin/Midland Basin (34% of reserves and 47% of 2024 production), and the Uinta Basin (15% of reserves and 5% of 2024 production).3Wikipedia text CC BY-SA 4.0
Revenue101112139$3.2B in 2025+98% since 2019Operating income101112139$1.0B in 2025Net income101112139$648.0M in 2025
Revenue1415$2.5B in Q2 FY2026+69% since Q1 FY2026Operating income1415$1.5B in Q2 FY2026Net income1415$1.1B in Q2 FY2026
Every line of the income statement as filed: the last 3 fiscal years, latest first.9
Period ending
2025-12-31
2024-12-31
2023-12-31
Oil, gas, and NGL production revenue
$3.1B
$2.7B
$2.4B
Other operating income
$16.0M
$19.0M
$10.0M
Total operating revenues and other income
$3.2B
$2.7B
$2.4B
Oil, gas, and NGL production expense
$885.0M
$637.0M
$564.0M
Depletion, depreciation, and amortization
$1.2B
$809.0M
$690.0M
Exploration
$57.0M
$64.0M
$59.0M
General and administrative
$161.0M
$138.0M
$121.0M
Net derivative gain
-$178.0M
-$50.0M
-$68.0M
Other operating expense
$22.0M
$16.0M
$21.0M
Total operating expenses
$2.2B
$1.6B
$1.4B
Income from operations
$1.0B
$1.1B
$987.0M
Interest expense
-$173.0M
-$141.0M
-$92.0M
Interest income
$3.0M
$32.0M
$20.0M
Other non-operating expense
$0
-$1.0M
-$1.0M
Income before income taxes
$830.0M
$966.0M
$914.0M
Income tax expense
-$182.0M
-$196.0M
-$96.0M
Net income
$648.0M
$770.0M
$818.0M
Basic weighted-average common shares outstanding
115.0M shares
115.0M shares
119.0M shares
Diluted weighted-average common shares outstanding
115.0M shares
116.0M shares
119.0M shares
Basic net income per common share
$5.65
$6.71
$6.89
Diluted net income per common share
$5.64
$6.67
$6.86
No quarter-by-quarter statement was filed.
Total assets16101112139$9.3B in 2025+47% since 2019Shareholders’ equity1112139$4.8B in 2025+75% since 2019Cash16101112139$368.0M in 2025+3679900% since 2019Long-term debt10$2.1B in 2021−6% since 2020
Total assets1415$18.9B in Q2 FY2026+104% since Q1 FY2025Shareholders’ equity1415$7.8B in Q2 FY2026+62% since Q1 FY2025Cash1415$620.0M in Q2 FY2026+68% since Q1 FY2025
Every line of the balance sheet as filed: the last 4 fiscal years (annual) or 4 quarters (quarterly), latest first.9
Period ending
2025-12-31
2024-12-31
2023-12-31
2022-12-31
Cash and cash equivalents
$368.0M
$0
Accounts receivable
$331.0M
$361.0M
Derivative assets
$83.0M
$49.0M
Prepaid expenses and other
$29.0M
$25.0M
Total current assets
$811.0M
$435.0M
Proved oil and gas properties
$16.0B
$14.3B
Accumulated depletion, depreciation, and amortization
-$8.8B
-$7.6B
Unproved oil and gas properties
$460.0M
$765.0M
Wells in progress
$458.0M
$482.0M
Other property and equipment, net of accumulated depreciation of $63 and $62, respectively
$65.0M
$48.0M
Total property and equipment, net
$8.2B
$8.0B
Derivative assets
$6.0M
$4.0M
Other noncurrent assets
$234.0M
$145.0M
Total noncurrent assets
$240.0M
$149.0M
Total assets
$9.3B
$8.6B
Accounts payable and accrued expenses
$690.0M
$760.0M
Senior Notes, net
$419.0M
$0
Derivative liabilities
$2.0M
$7.0M
Other current liabilities
$58.0M
$22.0M
Total current liabilities
$1.2B
$790.0M
Revolving credit facility
$0
$69.0M
Senior Notes, net
$2.3B
$2.7B
Asset retirement obligations
$150.0M
$145.0M
Net deferred tax liabilities
$724.0M
$545.0M
Derivative liabilities
$2.0M
$7.0M
Other noncurrent liabilities
$102.0M
$75.0M
Total noncurrent liabilities
$3.3B
$3.5B
Common stock, $0.01 par value - authorized: 200,000,000 shares; issued and outstanding: 114,630,905 and 114,461,934 shares, respectively
$1.0M
$1.0M
Additional paid-in capital
$1.5B
$1.5B
Retained earnings
$3.3B
$2.7B
Accumulated other comprehensive income (loss)
$1.0M
-$1.0M
Total stockholders equity
$4.8B
$4.2B
$3.6B
$3.1B
Total liabilities and stockholders equity
$9.3B
$8.6B
Unproved oil and gas properties, net of valuation allowance
$12.0M
$33.0M
Other property and equipment, net of accumulated depreciation
$63.0M
$62.0M
Common Stock, par value per share
$0.01
$0.01
Common Stock, shares authorized
200.0M shares
200.0M shares
Common Stock, shares issued
114.6M shares
114.5M shares
Common Stock, shares outstanding
114.6M shares
114.5M shares
Cash from operations101112139$2.0B in 2025+144% since 2019Dividends paid101112139$92.0M in 2025+717% since 2019Share buybacks1112139$13.0M in 2025
Cash flow is reported year to date, not quarter by quarter, so there are no separate quarterly figures.
Every line of the cash flow as filed: the last 3 fiscal years, latest first.9
Period ending
2025-12-31
2024-12-31
2023-12-31
Net income
$648.0M
$770.0M
$818.0M
Depletion, depreciation, and amortization
$1.2B
$809.0M
$690.0M
Stock-based compensation expense
$29.0M
$25.0M
$20.0M
Net derivative gain
-$178.0M
-$50.0M
-$68.0M
Net derivative settlement gain
$132.0M
$69.0M
$27.0M
Amortization of deferred financing costs
$10.0M
$7.0M
$5.0M
Deferred income taxes
$178.0M
$175.0M
$88.0M
Other, net
-$29.0M
-$35.0M
-$2.0M
Accounts receivable
$30.0M
-$86.0M
-$10.0M
Prepaid expenses and other
$1.0M
-$13.0M
-$2.0M
Accounts payable and accrued expenses
-$17.0M
$109.0M
$8.0M
Net cash provided by operating activities
$2.0B
$1.8B
$1.6B
Capital expenditures
-$1.4B
-$1.3B
-$989.0M
Acquisition of proved and unproved oil and gas properties
-$34.0M
-$2.1B
-$110.0M
Other, net
$4.0M
$7.0M
$1.0M
Net cash used in investing activities
-$1.5B
-$3.4B
-$1.1B
Proceeds from revolving credit facility
$1.6B
$1.0B
$0
Repayment of revolving credit facility
-$1.6B
-$950.0M
$0
Net proceeds from Senior Notes
$0
$1.5B
$0
Cash paid to repurchase Senior Notes
$0
$349.0M
$0
Repurchase of common stock
-$13.0M
-$86.0M
-$228.0M
Dividends paid
-$92.0M
-$85.0M
-$72.0M
Net proceeds from sale of common stock
$3.0M
$3.0M
$3.0M
Other, net
-$5.0M
-$20.0M
-$8.0M
Net cash provided by (used in) financing activities
-$175.0M
$1.0B
-$305.0M
Net change in cash, cash equivalents, and restricted cash
$368.0M
-$616.0M
$171.0M
Cash paid for interest, net of capitalized interest (1)
-$166.0M
-$88.0M
-$87.0M
Changes in capital expenditure accruals
-$39.0M
-$24.0M
$81.0M
Debt Related Commitment Fees and Debt Issuance Costs
SM Energy sits at the top of its group. 1 entity, 1 country on record. Switch between the flow chart and the network, and select any entity to see its details.
Built from parent and subsidiary links from GLEIF, the Global Legal Entity Identifier Foundation (CC0); major holders from Schedules 13D and 13G. Each entity in the chart links to its source.
What it owns
What SM Energy reports owning in its annual reports to the SEC: buildings, land and equipment, real estate and locations, investments, intangible assets and inventory, at the end of its latest fiscal year and a year before.
The company was founded in 1908 as the St. Mary Parish Land Company and was incorporated in 1915. In 1992, the company went public via an initial public offering. In May 2010, the company changed its name from St. Mary Land & Exploration Company to SM Energy.
Jul 31, 2025Reported quarterly or annual results98
Upcoming dates from Nasdaq's calendar; past results from the company's 8-K filings (Item 2.02). The full markets calendar
Filings
376 filings to the SEC since October 2021: 5 annual reports, 16 quarterly reports, 72 major events, 202 insider forms, 27 large holders, 54 other. The latest 20:
40 open-market trades by officers, directors and large owners since October 2021: 11 buys and 29 sales. Grants, option exercises and gifts are left out.
What the company paid its top executives, from the summary compensation table in its proxy statement. Total pay includes salary, bonus, stock and option awards and other pay, as the company valued them.
The largest holders among investment managers' 13F reports for the quarter ending Jun 30, 2026, the top 25 of 100. Change is in shares since the quarter before.
From the cover page of the 10-K filed Feb 26, 2026 (Section 12(b) of the Exchange Act).109
Risk factors and legal proceedings
The risks SM Energy names in Item 1A of its 10-K filed Feb 26, 2026: 50 risks under these headings, as written.109
Risks Related to the Civitas Merger
Risks Related to Commodity Prices and Global Macroeconomics
Risks Related to Oil and Gas Operations and the Industry
Risks Related to Litigation and Government Regulations
Risks Related to Debt, Liquidity, and Access to Capital
Risks Related to Corporate Governance and Ownership of Public Equity Securities
We may be unable to successfully integrate Civitas’ business into our business or achieve the anticipated benefits of the Merger, which may have a material adverse effect on our business, financial condition or results of operations.
We have incurred additional costs in connection with the Merger, which will continue during a portion of 2026.
Securities class action and derivative lawsuits may be brought against us in connection with the Merger, which could result in substantial costs.
The market price for our common stock may be affected by factors different from those that historically have affected SM Energy common stock or Civitas common stock.
Our ability to utilize certain tax attributes may be limited as a result of the Civitas Merger.
The historical business relationships of SM Energy and Civitas may be subject to disruption due to uncertainty associated with the Merger, which could have a material adverse effect on our results of operations, cash flows and financial position.
The other 44 risks
The synergies and other benefits attributable to the Merger may vary from expectations.
Oil, gas, and NGL prices are volatile, and declines in prices may adversely affect our profitability, financial condition, cash flows, access to capital, and ability to grow.
Future oil, gas, and NGL price declines or unsuccessful exploration efforts may result in write-downs of our asset carrying values.
Weakness in economic conditions, inflation, or uncertainty in financial markets may have material adverse impacts on our business that we cannot predict.
Global geopolitical tensions may create heightened volatility in oil, gas, and NGL prices and could adversely affect our business, financial condition and results of operations.
The proposed divestiture of certain of our South Texas assets may not be completed on the anticipated terms or at all, which could adversely affect our ability to execute our publicly stated deleveraging objectives.
The loss of personnel could adversely affect our business.
Our increasing dependence on digital technologies puts us at risk for a cyber incident that could result in information theft, data corruption, operational disruptions or financial loss.
We are incorporating artificial intelligence technologies into our processes and these technologies may present business, compliance, and reputational risks.
Competition in our industry is intense, and many of our competitors have greater financial, technical, and human resources than we do.
Our ability to sell oil, gas, and NGLs, and/or receive market prices for our production, may be adversely affected by constraints on gathering systems, processing facilities, pipelines, rail systems, and other transportation systems owned or operated by third-parties or by other interruptions beyond our control, which could obstruct, limit, or eliminate our access to oil, gas, and NGL markets.
We have entered into firm transportation contracts that require us to pay fixed sums of money to our counterparties regardless of the quantities actually transported under these contracts. If we are unable to deliver the necessary quantities of oil, gas, NGL, or produced water to our counterparties, our results of operations, financial position, and liquidity could be adversely affected.
We have limited control over the activities on properties we do not operate.
We rely on third-party service providers to conduct drilling and completion and other related operations.
The inability of customers or co-owners of assets to meet their obligations may adversely affect our financial results.
Many of our properties are in areas that may have been partially depleted or drained by offset wells and certain of our wells or future locations may be adversely affected by actions other operators may take when drilling, completing, or operating wells that they own.
Oil and gas drilling, completion, and production activities are subject to numerous risks, including the risk that no commercially producible oil, gas, or NGLs will be found.
The development of our proved undeveloped reserves may take longer and may require higher levels of capital expenditures than we currently anticipate. Therefore, our undeveloped reserves may not be ultimately developed or produced.
Our ability to produce oil, gas, and NGLs economically and in commercial quantities could be impaired if we are unable to acquire adequate supplies of water for our drilling and/or completions operations or are unable to dispose of or recycle the water we produce at a reasonable cost and in accordance with applicable environmental rules and regulations.
If we are unable to replace reserves and increase our reserve life index, we will not be able to sustain production.
The results of our operations are subject to drilling and completion technique risks, and results may not meet our expectations for reserves or production. As a result, we may incur material write-downs, and the value of our undeveloped acreage could decline if drilling and completion results are unsuccessful.
The actual quantities and present value of our proved oil, gas, and NGL reserves may be less than we have estimated, and the cost to develop our reserves may be more than we have estimated.
Our disposition activities may be subject to factors beyond our control, and in certain cases we may retain unforeseen liabilities for certain matters.
Title to the properties in which we have an interest may be impaired by title defects.
Our business could be negatively impacted by security threats, including cybersecurity threats, terrorism, armed conflict, and other disruptions.
We are subject to operating and environmental risks and hazards that could result in substantial losses or liabilities that may not be fully insured.
The impact of seasonal and extreme weather conditions and lease stipulations adversely affect our ability to conduct drilling activities in some of the areas where we operate.
In the future, we may be subject to claims, litigation, administrative proceedings and regulatory actions that may not be resolved in our favor.
Our operations are subject to complex laws and regulations, including environmental regulations, which result in substantial costs and other risks.
Federal and state legislative and regulatory initiatives relating to hydraulic fracturing could result in increased costs and additional operating restrictions or delays.
Federal and state regulatory initiatives relating to air quality and greenhouse gas emissions could result in increased costs and additional operating restrictions or delays.
Legislative and regulatory initiatives and litigation related to global warming and climate change could have an adverse effect on our operations and the demand for oil, gas, and NGLs, and could result in significant litigation, capital, and related expenses.
Requirements to reduce gas flaring could have an adverse effect on our operations.
Senate Bill 181’s requirement, which applies to our Colorado operations, that we own or control more than 45 percent of the working or mineral interest in order to statutorily pool our applicable interest may make it much more difficult for us to develop such interests, which could have a material adverse effect on our business, financial condition, and results of operations.
Commodity price declines could result in a decrease in the amount available to us under our Credit Agreement.
Negative public perception and investor sentiment regarding our business and the oil and gas industry as a whole could adversely affect our business, operations, and our ability to attract capital.
Substantial capital is required to develop and replace our reserves.
Downgrades in our credit ratings by various credit rating agencies could impact our access to capital and have a material adverse effect on our business and financial condition.
Our commodity derivative contract activities may result in financial losses or may limit the prices we receive for oil, gas, and NGL sales.
The amount of our debt may limit our ability to obtain financing for acquisitions, make us more vulnerable to adverse economic conditions, and make it more difficult for us to make payments on our debt.
The agreements governing our debt arrangements contain various covenants that limit our discretion in the operation of our business, could prohibit us from engaging in transactions we believe to be beneficial, and could lead to the accelerated repayment of our debt.
Our certificate of incorporation and by-laws have provisions that discourage corporate takeovers and could prevent stockholders from receiving a takeover premium on their investment, which could adversely affect the price of our common stock.
The price of our common stock may fluctuate significantly, which may result in losses for investors.
We may not always pay dividends on our common stock or repurchase common stock under our Stock Repurchase Program.
Legal proceedings
At times, we may be involved in litigation relating to claims arising out of our business and operations in the normal course of business. As of the filing of this report, no legal proceedings are pending against us that we believe individually or collectively are likely to have a material adverse effect upon our financial condition, results of operations, or cash flows.
With respect to administrative or judicial proceedings involving the environment, we have determined that we will disclose any such proceeding if we reasonably believe such proceeding will result in monetary sanctions, exclusive of interest and costs, of $1 million or more.