
Overview
Compare with NuScale or Terrestrial Energy Inc. /DE/, or pick any stock.
- TickerGTLS on NASDAQ1
- Industryenergy storage, medical device1
- HeadquartersBall Ground1
- Websitewww.chartindustries.com
- Legal formDelaware corporation1
- Incorporated inDE4
- Business address8665 New Trails Drive, Suite 100, The Woodlands, Tx 773814
- Filer categoryLarge accelerated filer4
- LEIEM7QGKC1GYOF3LSZSL803
- StatusActive3
- LEI statusLapsed (not renewed)3
- Registered addressC/O CORPORATION SERVICE COMPANY, 19808 Wilmington, United States3
- Registered withDivision of Corporations, Department of State, 23020683
See how the biggest companies compare on our leaderboards
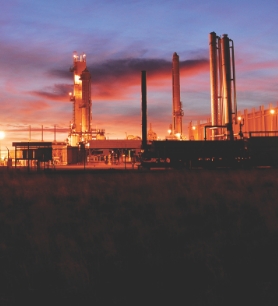
Chart Industries, Inc., a Delaware corporation incorporated in 1992 (the “Company,” “Chart,” “we,” “us,” or “our” as used herein refers to Chart Industries, Inc. and our consolidated subsidiaries, unless the context indicates otherwise), is a global leader in the design, engineering, and manufacturing of process technologies and equipment for gas and liquid molecule handling for the Nexus of Clean™ - clean power, clean water, clean food, and clean industrials, regardless of molecule. The Company’s unique product and solution portfolio across stationary and rotating equipment is used in every phase of the liquid gas supply chain, including engineering, service and repair and from installation to preventive maintenance and digital monitoring. Chart is a leading provider of technology, equipment and services related to liquefied natural gas (“LNG”), hydrogen, biogas and CO2 capture among ot…7 From its latest annual report
Financials
From the company’s reports to the SEC. Every number links to the filing it came from.
Key numbers, fiscal 2025
Where the money goes
Where each dollar of revenue went, fiscal 2025
- Cost of revenue66¢$2.8B
- Research and development1¢$41.9M
- Selling, general and admin15¢$619.1M
- Other costs17¢$725.7M
- Income tax0¢$10.4M
- Profit1¢$40.7M
Out of $4.3B in revenue.8
Where each dollar of operating cash went, fiscal 2025
- Capital spending31¢$89.9M
- Kept or used elsewhere69¢$202.8M
Out of $292.7M of cash from operations.8
Financial statements
| Fiscal year | 2019 | 2020 | 2021 | 2022 | 2023 | 2024 | 2025 |
|---|---|---|---|---|---|---|---|
| Revenue | $1.2B9 | $1.2B10 | $1.3B11 | $1.6B12 | $3.4B8 | $4.2B8 | $4.3B8 |
| Cost of revenue | $918.0M9 | $845.0M10 | $993.5M11 | $1.2B12 | $2.3B8 | $2.8B8 | $2.8B8 |
| Gross profit | $297.5M9 | $332.1M10 | $324.2M11 | $407.4M12 | $1.0B8 | $1.4B8 | $1.4B8 |
| Research and development | $9.2M9 | $9.1M10 | $12.7M11 | $13.5M12 | $23.3M8 | $38.3M8 | $41.9M8 |
| Selling, general and admin | $205.7M9 | $178.2M10 | $196.8M11 | $214.5M12 | $486.3M8 | $547.4M8 | $619.1M8 |
| Operating expenses | $235.7M11 | $255.9M12 | $649.7M8 | $741.3M8 | $1.1B8 | ||
| Operating income | $52.0M9 | $92.2M10 | $88.5M11 | $151.5M12 | $390.7M8 | $647.5M8 | $358.4M8 |
| Interest | $25.3M16 | ||||||
| Income before tax | $74.1M11 | $98.9M12 | $58.0M8 | $318.5M8 | $28.1M8 | ||
| Income tax | $2.8M9 | $14.9M10 | $13.5M11 | $15.9M12 | $3.0M8 | $78.6M8 | -$10.4M8 |
| Net income | $46.4M9 | $308.1M10 | $59.1M8 | $24.0M8 | $47.3M8 | $218.5M8 | $40.7M8 |
| Earnings per share | $1.379 | $8.7110 | $1.6611 | $0.6212 | $0.488 | $4.548 | $0.308 |
| Earnings per share (diluted) | $1.329 | $8.4510 | $1.4411 | $0.5412 | $0.438 | $4.108 | $0.308 |
| Shares (weighted, basic) | 35.6M shares11 | 36.2M shares12 | 42.0M shares8 | 42.1M shares8 | 45.1M shares8 | ||
| Shares (weighted, diluted) | 41.1M shares11 | 41.8M shares12 | 46.8M shares8 | 46.7M shares8 | 45.4M shares8 |
| Fiscal year | 2019 | 2020 | 2021 | 2022 | 2023 | 2024 | 2025 |
|---|---|---|---|---|---|---|---|
| Cash | $119.0M17 | $125.1M9 | $122.2M10 | $663.6M11 | $188.3M12 | $308.6M8 | $366.0M8 |
| Receivables | $236.3M10 | $278.4M11 | $758.9M12 | $752.3M8 | $782.1M8 | ||
| Inventory | $321.5M10 | $357.9M11 | $576.3M12 | $490.5M8 | $572.3M8 | ||
| Current assets | $673.6M17 | $703.0M9 | $853.5M10 | $3.7B11 | $2.2B12 | $2.5B8 | $2.9B8 |
| Property, plant and equipment | $416.0M10 | $430.0M10 | |||||
| Goodwill | $994.6M11 | $992.0M12 | $2.9B8 | $2.9B8 | $3.1B8 | ||
| Intangible assets | $556.1M10 | $535.3M11 | $2.8B12 | $2.5B8 | $2.5B8 | ||
| Total assets | $2.5B17 | $2.6B9 | $3.0B10 | $5.9B11 | $9.1B12 | $9.1B8 | $9.8B8 |
| Accounts payable | $175.9M10 | $211.1M11 | $811.0M12 | $1.1B8 | $1.2B8 | ||
| Short-term debt | $255.9M10 | $256.9M11 | $258.5M12 | $900.0K8 | $600.0K8 | ||
| Current liabilities | $378.3M17 | $634.8M9 | $693.9M10 | $1.1B11 | $1.9B12 | $1.8B8 | $2.1B8 |
| Long-term debt | $761.0M17 | $221.6M9 | $600.8M10 | $2.0B11 | $3.6B12 | $3.6B8 | $3.6B8 |
| Total liabilities | $1.2B17 | $991.2M9 | $1.4B10 | $3.2B11 | $6.2B12 | $6.1B8 | $6.4B8 |
| Retained earnings | $878.2M10 | $902.2M11 | $922.1M12 | $1.1B8 | $1.1B8 | ||
| Shareholders’ equity | $1.2B17 | $1.6B9 | $1.6B10 | $2.7B11 | $2.8B12 | $2.8B8 | $3.2B8 |
| Shares outstanding | 35.8M shares17 | 36.2M shares9 | 36.5M shares10 | 42.6M shares11 | 42.8M shares11 | 42.3M shares11 | 45.7M shares12 |
Cash flow is reported year to date, not quarter by quarter, so there are no separate quarterly figures.
| Fiscal year | 2019 | 2020 | 2021 | 2022 | 2023 | 2024 | 2025 |
|---|---|---|---|---|---|---|---|
| Cash from operations | $133.9M9 | $172.7M10 | -$21.3M11 | $80.8M12 | $167.2M8 | $503.0M8 | $292.7M8 |
| Depreciation and amortization | $80.6M11 | $1.2B12 | $2.3B8 | $2.8B8 | $2.8B8 | ||
| Stock-based compensation | $11.2M11 | $10.6M12 | $12.6M8 | $18.9M8 | $17.2M8 | ||
| Capital spending | $36.2M9 | $37.9M10 | $52.7M11 | $74.2M12 | $135.6M8 | $120.8M8 | $89.9M8 |
| Free cash flow | $97.7M | $134.8M | -$74.0M | $6.6M | $31.6M | $382.2M | $202.8M |
| Cash from investing | -$361.2M11 | -$101.6M12 | -$4.0B8 | -$141.3M8 | -$93.6M8 | ||
| Share buybacks | $09 | $19.3M10 | $010 | $010 | |||
| Cash from financing | $381.9M11 | $2.5B12 | $1.4B8 | -$243.7M8 | -$155.0M8 |
Corporate structure
Chart Industries, Inc sits at the top of its group. 124 entities, 40 countries on record. Switch between the flow chart and the network, and select any entity to see its details.
Major holders of Chart Industries, Inc
- Goldman Sachs Filed SCHEDULE 13G/A on Chart Industries, Inc, latest Aug 13, 2026 (2 filings since May 7, 2026)
- VANGUARD CAPITAL MANAGEMENT LLC Filed SCHEDULE 13G on Chart Industries, Inc, latest Jul 31, 2026
- BlackRock Filed SCHEDULE 13G/A on Chart Industries, Inc, latest Jul 27, 2026 (9 filings since Jan 26, 2022)
- VANGUARD GROUP INC Filed SCHEDULE 13G/A on Chart Industries, Inc, latest Mar 26, 2026 (5 filings since Feb 9, 2022)
- FMR LLC Filed SCHEDULE 13G/A on Chart Industries, Inc, latest Nov 5, 2025 (3 filings since Feb 9, 2024)
- Capital World Investors Filed SC 13G/A on Chart Industries, Inc, latest Jun 7, 2024 (5 filings since Dec 10, 2021)
- PRICE T ROWE ASSOCIATES INC /MD/ Filed SC 13G/A on Chart Industries, Inc, latest Feb 14, 2022
- DIMENSIONAL FUND ADVISORS LP Filed SC 13G/A on Chart Industries, Inc, latest Feb 8, 2022
- Chart Industries, Inc Garfield Heights, Ohio, United States
- Chart Ferox, a.s. Subsidiary · 100% · Ball Ground, Georgia, Georgia, United States
- ACI Labrador GP Inc. Subsidiary · Canada
- ACI Labrador Limited Partnership Subsidiary · Canada
- ACI Ventures East Inc. Subsidiary · Canada
- AdEdge India Water Technologies Private Limited Subsidiary · India
- Austcold Refrigeration Pty Limited Subsidiary · Australia
- Bond Acquisition Holdings Limited Subsidiary · United Kingdom
- Buffalo Forge SA de CV Subsidiary · Mexico
- Chart Asia Investment Company Limited Subsidiary · Hong Kong
- Chart Asia, Inc. Subsidiary · Delaware, United States
- Chart Australia Pty Ltd Subsidiary · Australia
- Chart Cryogenic Distribution Equipment (Changzhou) Company Limited Subsidiary · China
- Chart Cryogenic Engineering Systems (Changzhou) Co., Ltd. Subsidiary · China
- Chart D&S India Private Limited Subsidiary · India
- Chart Energy & Chemicals, Inc. Subsidiary · Delaware, United States
- Chart Germany GmbH Subsidiary · Germany
- Chart Inc. Subsidiary · Delaware, United States
- Chart Industries (Gibraltar) Limited Subsidiary · Gibraltar
- Chart Industries (Malaysia) Sdn. Bhd. Subsidiary · Malaysia
- Chart Industries Luxembourg S.à r.l. Subsidiary · Luxembourg
- Chart International Holdings, Inc. Subsidiary · Delaware, United States
- Chart International, Inc. Subsidiary · Delaware, United States
- Chart Italy Holdings S.r.l. Subsidiary · Italy
- Chart Latin America S.A.S. Subsidiary · Colombia
- Chart Leasing, LLC Subsidiary · Florida, United States
- and 98 more
Built from parent and subsidiary links from GLEIF, the Global Legal Entity Identifier Foundation (CC0); subsidiaries listed in Exhibit 21 of annual reports filed with the SEC; major holders from Schedules 13D and 13G. Each entity in the chart links to its source.
What it owns
What Chart Industries, Inc reports owning in its annual reports to the SEC: buildings, land and equipment, real estate and locations, investments, intangible assets and inventory, at the end of its latest fiscal year and a year before.
Property and equipment
| Item | Latest | A year before | Change |
|---|---|---|---|
| Finance-lease assets | $30.1M8 Dec 31, 2025 | $14.7M8 Dec 31, 2024 | +104.8% |
| Operating-lease assets (leased space) | $81.7M8 Dec 31, 2025 | $78.6M8 Dec 31, 2024 | +3.9% |
Investments
| Item | Latest | A year before | Change |
|---|---|---|---|
| Cash and cash equivalents | $366.0M8 Dec 31, 2025 | $308.6M8 Dec 31, 2024 | +18.6% |
| Stakes in other companies (equity method) | $96.2M8 Dec 31, 2025 | $94.0M8 Dec 31, 2024 | +2.3% |
Intangibles and goodwill
| Item | Latest | A year before | Change |
|---|---|---|---|
| Goodwill | $3.1B8 Dec 31, 2025 | $2.9B8 Dec 31, 2024 | +5.8% |
| Intangible assets, net (excluding goodwill) | $2.5B8 Dec 31, 2025 | $2.5B8 Dec 31, 2024 | −1.1% |
| Finite-lived intangibles, gross | $2.5B8 Dec 31, 2025 | $2.4B8 Dec 31, 2024 | +6.1% |
| Accumulated amortization | $694.5M8 Dec 31, 2025 | $479.9M8 Dec 31, 2024 | +44.7% |
Inventory
| Item | Latest | A year before | Change |
|---|---|---|---|
| Inventory, total | $572.3M8 Dec 31, 2025 | $490.5M8 Dec 31, 2024 | +16.7% |
| Work in process | $166.2M8 Dec 31, 2025 | $104.9M8 Dec 31, 2024 | +58.4% |
| Finished goods | $168.6M8 Dec 31, 2025 | $121.3M8 Dec 31, 2024 | +39.0% |
Properties, in its own words
We occupy 150 facilities throughout the world totaling approximately 12.9 million square feet with the majority devoted to manufacturing, assembly, and storage, none of which are individually material. Of these facilities, approximately 8.9 million square feet are owned, and approximately 4.0 million square feet are occupied under operating leases. Because Chart is global in nature, with substantial inter-segment cooperation, properties are often used by multiple business segments.
Regulatory Environment
The rest of Item 2
We are subject to federal, state, and local regulations relating to the discharge of materials into the environment, production and handling of hazardous and regulated materials, and the conduct and condition of our production facilities. We do not believe that these regulatory requirements have had a material effect on our capital expenditures, earnings, or competitive position. We are not anticipating any material capital expenditures in 2026 that are directly related to regulatory compliance matters. We are also not aware of any pending or potential regulatory changes that would have a material adverse impact on our business.
Item 2 of the 10-K filed Feb 27, 2026.7
Leadership
Who has led Chart Industries, Inc, and when. Pick a name to see everywhere that person has worked.
Chief executive
Chair
Chief financial officer
Chief operating officer
- Chief executive officerJillian C. Evanko Jul 10, 2018 to now18
- Chief executive officerSamuel F. Thomas Jul 25, 2006 to May 10, 201719
- ChairAndrew R. Cichocki Apr 3, 2025 to now20
- ChairSingleton B. McAllister Jul 5, 2022 to Jan 6, 202521
- ChairSteven W. Krablin Jul 5, 2018 to Apr 4, 202222
- ChairSamuel F. Thomas Mar 28, 2007 to Jan 9, 201823
- PresidentGerald F. Vinci Feb 26, 2026 to now24
- PresidentJillian C. Evanko Jul 10, 2018 to Feb 26, 202618
- PresidentSamuel F. Thomas Jul 25, 2006 to Jan 5, 201719
- Chief financial officerJoseph Robert Brinkman Oct 12, 2021 to now25
- Chief financial officerJeffrey Lass Jan 23, 2019 to Feb 5, 201926
- Chief financial officerJillian C. Evanko Jan 4, 2018 to Feb 18, 202127
- Chief financial officerKenneth J. Webster Apr 19, 2016 to Feb 17, 201728
- Chief financial officerMichael F. Biehl Jul 25, 2006 to Feb 19, 201629
- Chief operating officerJohn Champion Vii Bishop Aug 23, 2019 to Mar 25, 202030
Board members and other officers (37)
- Chief Technology OfficerBrian Patrick Bostrom Jan 17, 2023 to Jan 8, 202431
- Chief Accounting OfficerStephanie Winn Everett Jun 5, 2023 to Jan 6, 202532
- Chief Technology OfficerDouglas A. Ducote Jr. May 21, 2021 to Jan 5, 202333
- Chief Commercial OfficerJoseph A. Belling May 21, 2021 to now34
- VP, GC and SecretaryHerbert Hotchkiss Mar 29, 2019 to now35
- Chief Accounting OfficerScott W. Merkle Sep 6, 2019 to Jan 5, 202136
- CAO and Corporate ControllerMichael Schmit Jun 20, 2018 to Mar 21, 201937
- Vice President of FinanceJillian C. Evanko Feb 27, 2017 to Feb 27, 201738
- VP & Chief Human Resources OfcGerald F. Vinci Sep 1, 2017 to now39
- VP, GC and SecretaryDewayne R. Youngberg Nov 6, 2017 to Jan 4, 201840
- CAO and ControllerMary C. Cook Apr 19, 2016 to Jan 5, 201741
- CAO & ControllerKenneth J. Webster Mar 7, 2008 to Feb 19, 201642
- Chief Accounting OfficerJames H. Hoppel Jr. Jul 25, 2006 to Feb 24, 201043
- Board memberAndrew R. Cichocki May 26, 2023 to Jan 6, 202544
- Board memberPaul E. Mahoney May 26, 2023 to now45
- Board memberSpencer S. Stiles May 26, 2023 to now46
- Board memberLinda S. Harty Aug 27, 2021 to now47
- Board memberRoger A. Strauch Aug 27, 2021 to now48
- Board memberDavid M. Sagehorn May 23, 2019 to now49
- Board memberSingleton B. McAllister Nov 22, 2019 to now50
- Board memberCarey Chen May 29, 2018 to Apr 4, 202251
- Board memberJillian C. Evanko Jul 10, 2018 to now18
- Board memberMichael Molinini Mar 15, 2017 to now52
- Board memberElizabeth G. Spomer May 23, 2014 to Apr 3, 202053
- Board memberTerrence J. Keating May 23, 2014 to Apr 4, 201854
- Board memberThomas L. Williams May 22, 2008 to Apr 3, 201955
- Board memberW. Douglas Brown May 22, 2008 to May 12, 202056
- Board memberJames M. Tidwell Jul 11, 2007 to Apr 3, 201357
- Board memberBen A. Guill Jul 25, 2006 to Mar 20, 200758
- Board memberKenneth W. Moore Jul 25, 2006 to Aug 3, 200759
- Board memberSamuel F. Thomas Jul 25, 2006 to Mar 26, 200719
- Board memberSteven W. Krablin Jul 25, 2006 to Apr 4, 201860
- Board memberTimothy H. Day Jul 25, 2006 to Aug 3, 200761
- Board memberMichael W. Press Aug 17, 2006 to Apr 5, 201662
- Board memberRichard E. Goodrich Aug 17, 2006 to Apr 4, 201863
- General counselRobert H. Wolfe Nov 14, 2016 to Jan 5, 201764
- General counselMatthew J. Klaben Jul 25, 2006 to Feb 19, 201665
Named in SEC Form D filings
People the company listed in its private-offering notices.
- DirectorPaula F. Harris named Dec 14, 202166
Subsidiaries and ownership
Subsidiaries (Exhibit 21)
- ACI Labrador GP Inc. Canada5
- ACI Labrador Limited Partnership Canada5
- ACI Ventures East Inc. Canada5
- AdEdge India Water Technologies Private Limited India5
- Austcold Refrigeration Pty Limited Australia5
- Bond Acquisition Holdings Limited England & Wales5
- Buffalo Forge SA de CV Mexico5
- CPI-Liard SAS France5
- CSC Cryogenic Service Center AB Sweden5
- Chart Asia Investment Company Limited Hong Kong5
- Chart Asia, Inc. Delaware5
- Chart Australia Pty Ltd Australia5
- Chart Cryogenic Distribution Equipment (Changzhou) Company Limited China5
- Chart Cryogenic Engineering Systems (Changzhou) Co., Ltd. China5
- Chart D&S India Private Limited India5
- Chart Energy & Chemicals, Inc. Delaware5
- Chart Ferox, a.s. Czech Republic5
- Chart Germany GmbH Germany5
- Chart Inc. Delaware5
- Chart Industries (Gibraltar) Limited Gibraltar5
- Chart Industries (Malaysia) Sdn. Bhd. Malaysia5
- Chart Industries Luxembourg S.à r.l. Luxembourg5
- Chart International Holdings, Inc. Delaware5
- Chart International, Inc. Delaware5
All 127 listed subsidiaries
- Chart Italy Holdings S.r.l. Italy5
- Chart Latin America S.A.S. Colombia5
- Chart Leasing, LLC Florida5
- Chart Lifecyle, Inc. Delaware5
- ChartWater, LLC Georgia5
- Compressor Products International (Shanghai) Co., Ltd. China5
- Compressor Products International GmbH Germany5
- Compressor Products International LLC Delaware5
- Compressor Products International Limited England & Wales5
- Compressor Products International South Korea Co. Ltd South Korea5
- Cryogenic Gas Technologies, Inc. Pennsylvania5
- ESAB Technology Limited England & Wales5
- Earthly Labs, LLC Delaware5
- Engart Fans Limited England & Wales5
- Fema S.r.l. Italy5
- Flow Instruments & Engineering GmbH Germany5
- GOFA Gocher Fahrzeugbau GmbH Germany5
- Granite Acquisition GmbH Germany5
- Granite Holdings Global Limited England & Wales5
- Granite Holdings II B.V. Netherlands5
- Hetsco Holdings, Inc. Delaware5
- Hetsco, Inc. Delaware5
- HowMex Holdings S. de R.L. de C.V Mexico5
- Howden Africa (Proprietary) Limited South Africa5
- Howden Africa Holdings (Pty) Ltd South Africa5
- Howden Air and Gas India Private Limited India5
- Howden Australia Pty Limited Australia5
- Howden Axial Fans AB Sweden5
- Howden Axial Fans ApS Denmark5
- Howden BC Compressors France5
- Howden CKD Compressors s.r.o Czech Republic5
- Howden CPI Netherlands B.V. Netherlands5
- Howden Canada Inc. Canada5
- Howden Chile SpA Chile5
- Howden Compressors Limited Scotland5
- Howden Donkin (Proprietary) Limited South Africa5
- Howden Engineering (S.E. Asia) Limited Hong Kong5
- Howden Engineering Limited Scotland5
- Howden Finance Limited England & Wales5
- Howden GmbH Germany5
- Howden Group B.V. Netherlands5
- Howden Group Limited England & Wales5
- Howden Group Netherlands B.V. Netherlands5
- Howden Group South Africa (Pty) Ltd South Africa5
- Howden Holdings ApS Denmark5
- Howden Holdings B.V. Netherlands5
- Howden Holdings Unlimited England & Wales5
- Howden Hua Engineering Company Limited China5
- Howden Hungary Kft. Hungary5
- Howden International Holdings B.V. Netherlands5
- Howden Japan Limited Japan5
- Howden Korea Limited South Korea5
- Howden Maintenance Partners Belgium nv Belgium5
- Howden Maintenance Partners France France5
- Howden Maintenance Partners Wallonie nv Belgium5
- Howden Maintenance Partners nv Belgium5
- Howden Mexico Calentadores Regenerativos SRL de CV Mexico5
- Howden Middle East FZCO United Arab Emirates5
- Howden Netherlands B.V. Netherlands5
- Howden Perú SRL Peru5
- Howden Poland sp. z o.o. Poland5
- Howden SA Holdings Pty Ltd South Africa5
- Howden Singapore Pte.Ltd. Singapore5
- Howden Solyvent-Ventec SAS France5
- Howden South America Ventiladores e Compressores Industria e Comercio Ltda Brazil5
- Howden Spain SL Spain5
- Howden Taiwan Company Limited Taiwan5
- Howden Thomassen Compressors B.V. Netherlands5
- Howden Turbo Fans Oy Finland5
- Howden Turbo GmbH Germany5
- Howden Turbo UK Limited England & Wales5
- Howden Turkey Air and Gas Handling Makina Sanayi ve Ticaret Limited Şirketi Turkey5
- Howden UK Limited Northern Ireland5
- Howden USA Company Delaware5
- Howden Ventsim Pty Ltd Australia5
- Howden Vietnam Company Limited Vietnam5
- Howden Zambia Limited Zambia5
- Hudson Heat Transfer International, Inc. Panama5
- Hudson Products Corporation Texas5
- Hudson Products Holdings Cooperatief UA Netherlands5
- Hudson Products de Mexico, S.A. de C.V. Mexico5
- Hylium-Chart Inc. South Korea5
- Industrie Meccaniche di Bagnolo S.r.l. Italy5
- Inmobiliaria Tepalcapa SA de CV Mexico5
- James Howden & Company Limited Scotland5
- James Howden & Godfrey Overseas Limited Scotland5
- James Howden (Thailand) Limited Thailand5
- James Howden Holdings (Pty) Limited South Africa5
- L.A. Turbine California5
- Maintenance Partners Morocco Morocco5
- Nanjing New Metallurgy Electric Engineering Co., Ltd. China5
- PT Howden Indonesia APAC Indonesia5
- PT. Thermax Indonesia5
- Prefontaine Properties, Inc. New Hampshire5
- Skaff Cryogenics, Inc. New Hampshire5
- Spencer Turbine Trading (Beijing) Co., Ltd. China5
- Sustainable Energy Solutions, Inc. Utah5
- Thermax, Inc. Massachusetts5
- VCT Vogel GmbH Germany5
- VRV Asia Pacific Private Limited India5
- VRV S.r.l. Italy5
- Ventilation Holding France SAS France5
- Weldcure Limited England & Wales5
The subsidiaries the company lists in Exhibit 21 of its annual report, as filed.
Acquisitions
- 2023Acquired Roots Blowers1
Timeline
- Jul 16, 20268-K Completed an acquisition or sale; Listing notice or transfer; Change to shareholders' rights67
- Jun 22, 20268-K Other events68
- Jun 15, 20268-K Executive or director change69
- May 21, 20268-K Other events70
- Feb 27, 20268-K Results of operations71
- Jan 9, 20268-K Executive or director change72
- Dec 29, 20258-K Executive or director change73
- Dec 11, 20258-K Other events74
- Nov 17, 20258-K Executive or director change; Regulation FD disclosure75
- Nov 7, 20258-K Other events76
- Oct 29, 20258-K Results of operations77
- Oct 6, 20258-K Shareholder vote; Regulation FD disclosure78
- Jul 10, 2018New chief executive Jillian C. Evanko becomes CEO18
- Jul 25, 2006New chief executive Samuel F. Thomas becomes CEO19
Calendar
When it reported results
- Feb 27, 2026Reported quarterly or annual results71
- Oct 29, 2025Reported quarterly or annual results77
- Jul 29, 2025Reported quarterly or annual results79
- May 1, 2025Reported quarterly or annual results80
- Feb 28, 2025Reported quarterly or annual results81
- Nov 1, 2024Reported quarterly or annual results82
- Aug 2, 2024Reported quarterly or annual results83
- May 3, 2024Reported quarterly or annual results84
Upcoming dates from Nasdaq's calendar; past results from the company's 8-K filings (Item 2.02). The full markets calendar
Filings
466 filings to the SEC since October 2021: 5 annual reports, 14 quarterly reports, 71 major events, 303 insider forms, 27 large holders, 1 private raises, 45 other. The latest 20:
- Aug 13, 2026SCHEDULE 13G/A EDGAR
- Jul 31, 2026SCHEDULE 13G EDGAR
- Jul 29, 202615-12G EDGAR
- Jul 27, 2026SCHEDULE 13G/A EDGAR
- Jul 16, 20264 EDGAR
- Jul 16, 20264 EDGAR
- Jul 16, 20264 EDGAR
- Jul 16, 20264 EDGAR
- Jul 16, 20264 EDGAR
- Jul 16, 20264 EDGAR
- Jul 16, 20264 EDGAR
- Jul 16, 20264 EDGAR
- Jul 16, 20264 EDGAR
- Jul 16, 20264 EDGAR
- Jul 16, 20264 EDGAR
- Jul 16, 2026S-8 POS EDGAR
- Jul 16, 2026S-8 POS EDGAR
- Jul 16, 2026S-8 POS EDGAR
- Jul 16, 20268-K EDGAR
- Jul 16, 20264 EDGAR
The 466 filings since October 2021 can be filtered by form type and year here when JavaScript is on.
Every filing from the last five years, summarized. The full record is on SEC EDGAR.
Insider trades
24 open-market trades by officers, directors and large owners since October 2021: 24 buys and 0 sales. Grants, option exercises and gifts are left out.
| Date | Who | Trade | Shares | Price | Value | Filing |
|---|---|---|---|---|---|---|
| Mar 14, 2025 | Brinkman Joseph RobertVP & Chief Financial Officer | Buy | 328 | $149.78 | $49.1K | Form 4 |
| Mar 12, 2025 | Vinci Gerald FPresident | Buy | 175 | $147.89 | $25.9K | Form 4 |
| Mar 10, 2025 | Harty Linda SDirector | Buy | 500 | $140.85 | $70.4K | Form 4 |
| Mar 10, 2025 | Hotchkiss HerbertVP, GC and Secretary | Buy | 84 | $141.87 | $11.9K | Form 4 |
| Mar 6, 2025 | Evanko Jillian C.Former President and CEO | Buy | 350 | $150.35 | $52.6K | Form 4 |
| Nov 15, 2024 | Evanko Jillian C.Former President and CEO | Buy | 303 | $164.35 | $49.8K | Form 4 |
| Sep 16, 2024 | Harty Linda SDirector | Buy | 5,000 | $48.05 | $240.2K | Form 4 |
| Sep 16, 2024 | Hotchkiss HerbertVP, GC and Secretary | Buy | 212 | $117.72 | $25.0K | Form 4 |
| Sep 13, 2024 | Harty Linda SDirector | Buy | 1,000 | $113.50 | $113.5K | Form 4 |
| Sep 11, 2024 | Mahoney Paul EDirector | Buy | 500 | $106.55 | $53.3K | Form 4 |
| Sep 5, 2024 | Evanko Jillian C.Former President and CEO | Buy | 440 | $114.31 | $50.3K | Form 4 |
| May 16, 2024 | Harty Linda SDirector | Buy | 500 | $155.00 | $77.5K | Form 4 |
| May 10, 2024 | Evanko Jillian C.Former President and CEO | Buy | 490 | $153.44 | $75.2K | Form 4 |
| Dec 15, 2023 | Harty Linda SDirector | Buy | 1,000 | $130.14 | $130.1K | Form 4 |
| Dec 14, 2023 | Harty Linda SDirector | Buy | 500 | $134.45 | $67.2K | Form 4 |
| Dec 11, 2023 | CICHOCKI ANDREW RChair of the Board | Buy | 400 | $126.88 | $50.8K | Form 4 |
| Mar 21, 2023 | Vinci Gerald FPresident | Buy | 300 | $119.28 | $35.8K | Form 4 |
| Mar 20, 2023 | STRAUCH ROGER ADirector | Buy | 100 | $109.86 | $11.0K | Form 4 |
| Mar 20, 2023 | Harty Linda SDirector | Buy | 5,000 | $105.01 | $525.0K | Form 4 |
| Mar 20, 2023 | Evanko Jillian C.Former President and CEO | Buy | 2,375 | $104.29 | $247.7K | Form 4 |
All 24 trades can be filtered by person here when JavaScript is on.
From Forms 4 filed with the SEC.
Major holders
Investors who own more than 5% of the shares must tell the SEC: a 13D if they may seek to influence the company, a 13G if they hold passively.
- Goldman SachsSCHEDULE 13G/A, 2 filings May 7, 2026 to Aug 13, 202685
- VANGUARD CAPITAL MANAGEMENT LLCSCHEDULE 13G, 1 filing Jul 31, 202686
- BlackRockSCHEDULE 13G/A, 9 filings Jan 26, 2022 to Jul 27, 202687
- VANGUARD GROUP INCSCHEDULE 13G/A, 5 filings Feb 9, 2022 to Mar 26, 202688
- FMR LLCSCHEDULE 13G/A, 3 filings Feb 9, 2024 to Nov 5, 202589
- Capital World InvestorsSC 13G/A, 5 filings Dec 10, 2021 to Jun 7, 202490
- PRICE T ROWE ASSOCIATES INC /MD/SC 13G/A, 1 filing Feb 14, 202291
- DIMENSIONAL FUND ADVISORS LPSC 13G/A, 1 filing Feb 8, 202292
Executive pay
What the company paid its top executives, from the summary compensation table in its proxy statement. Total pay includes salary, bonus, stock and option awards and other pay, as the company valued them.
| Year | Executive | Age | Salary | Total pay |
|---|---|---|---|---|
| 2024 | Jillian C. Evanko(President, Chief Executive Officer, and Chief Financial Officer) | $1.1M | $7.7M93 | |
| 2024 | Herbert G. Hotchkiss(Vice President, General Counsel and Secretary) | $540.0K | $2.0M93 | |
| 2024 | Gerald F. Vinci(Vice President, Chief Human Resources Officer) | $515.0K | $1.7M93 | |
| 2024 | Joseph R. Brinkman(Vice President and Chief Financial Officer) | $475.0K | $1.5M93 | |
| 2024 | Joseph A. Belling(Chief Technology Officer) | $450.0K | $1.2M93 | |
| 2023 | Jillian C. Evanko(President, Chief Executive Officer, and Chief Financial Officer) | $1.0M | $5.4M93 | |
| 2023 | Herbert G. Hotchkiss(Vice President, General Counsel and Secretary) | $444.8K | $1.0M93 | |
| 2023 | Gerald F. Vinci(Vice President, Chief Human Resources Officer) | $444.8K | $1.0M93 | |
| 2023 | Joseph A. Belling(Chief Technology Officer) | $412.2K | $937.3K93 | |
| 2023 | Joseph R. Brinkman(Vice President and Chief Financial Officer) | $389.0K | $892.1K93 | |
| 2022 | Jillian C. Evanko(President, Chief Executive Officer, and Chief Financial Officer) | $1.0M | $5.1M93 | |
| 2022 | Gerald F. Vinci(Vice President, Chief Human Resources Officer) | $410.4K | $1.7M93 | |
| 2022 | Joseph R. Brinkman(Vice President and Chief Financial Officer) | $340.0K | $1.6M93 | |
| 2022 | Joseph A. Belling(Chief Technology Officer) | $350.2K | $1.4M93 | |
| 2022 | Herbert G. Hotchkiss(Vice President, General Counsel and Secretary) | $410.3K | $1.3M93 |
Funding
Where the company's money came from, by calendar year: private offerings filed with the SEC, federal grants, loans, contracts and other assistance from USAspending.gov, and PPP loans from the SBA. Each bar links to the records below.
- Private raises (Form D) $23.8M
Figures by year
| Year | Private raises (Form D) | Total |
|---|---|---|
| 2021 | $23.8M | $23.8M |
Private raises
Private offerings the company reported to the SEC on Form D. The amount is what the latest filing says was sold so far, charted in the year of the first sale. Covers filings since Oct 1, 2021.
Members of Congress who traded it
9 trades disclosed by members of Congress. “Vs S&P since” is the stock’s change since the trade minus the S&P 500’s.
| Date | Member | Trade | Amount | Vs S&P since | Filing |
|---|---|---|---|---|---|
| Jul 17, 2026 | Josh GottheimerDemocratic, House | Sale | $1,001 - $15,000 | Report | |
| Sep 2, 2025 | Gilbert Ray Cisneros, Jr.Democratic, House | Partial sale | $1,001 - $15,000 | Report | |
| Jun 16, 2025 | Gilbert Ray Cisneros, Jr.Democratic, House | Partial sale | $1,001 - $15,000 | Report | |
| Jan 11, 2024 | Josh GottheimerDemocratic, House | Buy | $1,001 - $15,000 | Report | |
| Dec 11, 2023 | Josh GottheimerDemocratic, House | Partial sale | $1,001 - $15,000 | Report | |
| Jul 14, 2023 | Josh GottheimerDemocratic, House | Buy | $1,001 - $15,000 | Report | |
| Apr 10, 2023 | Daniel S. GoldmanDemocratic, House | Buy | $1,001 - $15,000 | Report | |
| Dec 9, 2022 | Alan S. Lowenthal, House | Buy | $15,001 - $50,000 | Report | |
| Dec 9, 2022 | Alan S. Lowenthal, House | Buy | $1,001 - $15,000 | Report |
Members report amounts as ranges, not exact figures. Returns are price-only (no dividends).
SEC filer profile
How Chart Industries, Inc is registered with the Securities and Exchange Commission, from its EDGAR record and the cover page of its latest annual report.
- Name on EDGARCHART INDUSTRIES INC2
- CIK0000892553
- Employer ID (EIN)34-17129377
- Filer statusLarge accelerated filer not an emerging growth company; not a smaller reporting company; not a shell company7
- Incorporated inDelaware7
- Fiscal year endsDecember 312
- Industry code (SIC)3443 Fabricated Plate Work (Boiler Shops)2
- SEC reviewing officeOffice of Manufacturing, Division of Corporation Finance2
- Business address8665 New Trails Drive, Suite 100, The Woodlands, TX 773812
- Phone281-364-87002
- Shares outstanding47,869,076 as of May 7, 202615
- Public float$7.5B as of Jun 30, 20257
- AuditorDeloitte & Touche LLP, Atlanta, Georgia PCAOB ID 34; it also attests to the company’s internal control over financial reporting7
- On EDGAR sinceMay 15, 19962
- Filings1,883 in all: 4 (923), 8-K (388), SC 13G/A (99), 10-Q (89), 3 (58), SC 13G (41), 10-K (28), DEF 14A (27)2
All 54 form types
UPLOAD (25), CORRESP (18), 425 (16), ARS (14), S-8 (14), DEFA14A (13), SC 13D/A (13), SD (13), 8-K/A (11), 424B5 (7), S-1/A (7), FWP (6), SC 13D (6), SCHEDULE 13G/A (6), 5 (5), REGDEX (4), 10-K/A (3), 424B4 (3), 8-A12B (3), EFFECT (3), S-3ASR (3), S-8 POS (3), 10-Q/A (2), 144 (2), 15-12B (2), 25-NSE (2), 8-A12G (2), CERT (2), S-1 (2), S-3 (2), S-3/A (2), SCHEDULE 13G (2), 10-K405 (1), 15-12G (1), 25 (1), 3/A (1), 4/A (1), 424B2 (1), D (1), DEFM14A (1), NT 10-K (1), NT 10-Q (1), PRE 14A (1), PREM14A (1), S-4 (1), S-4/A (1)
- Latest filingsAnnual report (10-K) Feb 27, 2026
Quarterly report (10-Q) May 11, 2026
Proxy statement (DEF 14A) Apr 8, 2025
Latest 8-K (8-K) Jul 16, 2026
Securities registered for trading
| Class | Symbol | Exchange |
|---|---|---|
| Common Stock, par value $0.01 | GTLS | New York Stock Exchange |
From the cover page of the 10-K filed Feb 27, 2026 (Section 12(b) of the Exchange Act).7
Risk factors and legal proceedings
The risks Chart Industries, Inc names in Item 1A of its 10-K filed Feb 27, 2026: 34 risks under these headings, as written.7
- Risks Related to Our Business
- The markets we serve are subject to cyclical demand and vulnerable to economic downturn, which could harm our business and make it difficult to project long-term performance.
- The loss of, or significant reduction or delay in, purchases by our largest customers could reduce our sales and profitability.
- If we are unable to successfully control our costs and efficiently manage our operations, it may lead to increased costs and reduced profitability.
- We depend on the availability of certain key suppliers; if we experience difficulty with a supplier, we may have difficulty finding alternative sources of supply.
- Our results of operations could materially suffer if we are unable to obtain sufficient pricing for our products and services to meet our profitability expectations.
- Changes in U.S. trade policy, tariff and import/export regulations may have a material adverse effect on our business, financial condition and results of operations.
- As a global business, we are exposed to economic, political, and other risks in different countries which could materially reduce our sales, profitability or cash flows, or materially increase our liabilities.
- We carry goodwill and indefinite-lived intangible assets on our balance sheet, which are subject to impairment testing and could subject us to significant non-cash charges to earnings in the future if impairment occurs.
- Our backlog is subject to modification, termination or reduction of orders, which could negatively impact our sales.
- Due to the nature of our business and products, we may be liable for damages based on product liability and warranty claims.
- Energy policies could change or expected changes could fail to materialize which could adversely affect our business or prospects.
The other 23 risks
- Fluctuations in currency exchange or interest rates may adversely affect our financial condition and operating results.
- We may fail to successfully integrate companies that provide complementary products or technologies.
- Failure to protect our intellectual property and know-how could reduce or eliminate any competitive advantage and reduce our sales and profitability, and the cost of protecting our intellectual property may be significant.
- Data privacy and data security considerations could impact our business.
- We are subject to potential insolvency or financial distress of third parties.
- We may be required to make expenditures in order to comply with environmental, health and safety laws and emissions regulations, or incur additional liabilities under these laws and regulations.
- We operate in many different jurisdictions, and we could be adversely affected by violations of the U.S. Foreign Corrupt Practices Act and similar worldwide anti-corruption laws.
- Our operations could be impacted by the effects of severe weather.
- We are subject to regulations governing the export of our products.
- As a provider of products to the U.S. government, we are subject to certain federal rules, regulations, audits and investigations, the violation or failure of which could adversely affect our business.
- Tax rules are subject to change, and unanticipated changes in our effective tax rate could adversely affect our future results.
- We could be obligated to make significant contributions to our pension plans, some of which are underfunded, and we contribute to a multi-employer plan for collective bargaining U.S. employees, which is underfunded.
- The departure of any of our key personnel could materially and adversely affect us.
- A public health crisis could cause disruptions to our operations which could adversely affect our business in the future.
- Risks Related to Our Leverage
- Our leverage and future debt service obligations could adversely affect our business, financial condition, and results of operations and our ability to meet our payment obligations under our debt.
- We may incur substantial additional indebtedness, which could further exacerbate the risks that we face.
- The terms of our existing debt may limit our ability to finance future operations or capital needs or engage in other business activities that may be in our interest.
- Our Senior Secured Notes due 2030 and our Senior Unsecured Notes due 2031 have certain change in control features which, if triggered, may adversely affect our financial condition.
- Risks Related to the Merger and Ownership of Common Stock
- The proposed Merger is subject to the satisfaction of certain closing conditions, including government consents and approvals, some or all of which may not be satisfied or completed by the closing.
- We are subject to various uncertainties and restrictions on the conduct of our business while the Merger is pending, which could have a material adverse effect on our business, results of operations and financial condition.
- We will continue to incur substantial transaction-related costs in connection with the Merger.
- We and our directors and officers may be subject to lawsuits relating to the Merger.
- Provisions of the Merger Agreement may deter alternative business combinations and could negatively impact our stock price if the Merger Agreement is terminated in certain circumstances.
Legal proceedings
Ordinary Course Litigation
We are occasionally subject to various legal claims related to performance under contracts, product liability, taxes, employment matters, environmental matters, intellectual property, and other matters incidental to the normal course of our
business. Based on our historical experience in litigating these claims, as well as our current assessment of the underlying merits of the claims and applicable insurance, if any, management believes that the final resolution of these matters will not have a material adverse effect on our financial position, liquidity, cash flows, or results of operations, except that our results of operations for any particular reporting period may be adversely affected by any potential or actual loss that is accrued in such period. Future developments may, however, result in resolution of these legal claims in a way that could have a material adverse effect.
Supplemental Disclosure
The opening of Item 3, Legal Proceedings.7
Links
- Websitewww.chartindustries.com1
- WikidataQ22661749
- SEC EDGARCIK 892553
Sources
The numbers on this page point here. Each one links to the record it came from.
- 1
- 2
- 3
- 4
- 5
- 6Company websiteChart Industries, Inc photo
- 7
- 8
- 9
- 10
- 11
- 12
- 13
- 14
- 15
- 16
- 17
- 18
- 19
- 20SEC EDGARAndrew R. Cichocki, Chair
- 21SEC EDGARSingleton B. McAllister, Chair
- 22SEC EDGARSteven W. Krablin, Chair
- 23SEC EDGARSamuel F. Thomas, Chair
- 24SEC EDGARGerald F. Vinci, President
- 25
- 26
- 27
- 28
- 29
- 30
- 31
- 32
- 33
- 34
- 35
- 36
- 37
- 38
- 39
- 40
- 41SEC EDGARMary C. Cook, CAO and Controller
- 42SEC EDGARKenneth J. Webster, CAO & Controller
- 43
- 44SEC EDGARAndrew R. Cichocki, Board member
- 45SEC EDGARPaul E. Mahoney, Board member
- 46SEC EDGARSpencer S. Stiles, Board member
- 47SEC EDGARLinda S. Harty, Board member
- 48SEC EDGARRoger A. Strauch, Board member
- 49SEC EDGARDavid M. Sagehorn, Board member
- 50
- 51SEC EDGARCarey Chen, Board member
- 52SEC EDGARMichael Molinini, Board member
- 53SEC EDGARElizabeth G. Spomer, Board member
- 54SEC EDGARTerrence J. Keating, Board member
- 55SEC EDGARThomas L. Williams, Board member
- 56SEC EDGARW. Douglas Brown, Board member
- 57SEC EDGARJames M. Tidwell, Board member
- 58SEC EDGARBen A. Guill, Board member
- 59SEC EDGARKenneth W. Moore, Board member
- 60SEC EDGARSteven W. Krablin, Board member
- 61SEC EDGARTimothy H. Day, Board member
- 62SEC EDGARMichael W. Press, Board member
- 63SEC EDGARRichard E. Goodrich, Board member
- 64SEC EDGARRobert H. Wolfe, General counsel
- 65SEC EDGARMatthew J. Klaben, General counsel
- 66
- 67
- 68SEC EDGAROther events
- 69SEC EDGARExecutive or director change
- 70SEC EDGAROther events
- 71SEC EDGARResults of operations
- 72SEC EDGARExecutive or director change
- 73SEC EDGARExecutive or director change
- 74SEC EDGAROther events
- 75
- 76SEC EDGAROther events
- 77SEC EDGARResults of operations
- 78
- 79
- 80
- 81
- 82
- 83
- 84
- 85
- 86
- 87
- 88
- 89
- 90
- 91
- 92
- 93